
In 24 hours, one broker against one PostgreSQL moved 51,820,403,100 messages (about 600,000
per second in each direction) with leased pops and explicit acknowledgement, zero restarts, and
resident memory flat at roughly 6.3 GB. The host was a 32 vCPU / 62 GiB machine and the broker
was commit 615efdc. Artifacts are in benchmark-queen/2026-07-25-soak24/, and the loader’s own
stdout is raw/soak24b.out.
This is the reference run for production semantics, and the only one long enough to distinguish “fast” from “stays fast”.
Configuration
The loader printed its own configuration, which is what makes this quotable:
goload -mode openloop -> queue=segbench partitions=200 consumers=600 manualAck=true ackAsync=true ackInflight=256
  offered: rate=600000 msg/s | push-batch=100 -> 6000.0 req/s across 64 pacer workers | max-inflight=20000 | payload=256B
[configure] queue=segbench completedRetentionSeconds=300| Parameter | Value | Why it matters |
|---|---|---|
| Delivery semantics | leased pops with explicit acks (manualAck=true) |
The cursor moves only on an ack, which is the at-least-once path real work uses. Server-side auto-ack would remove one round trip and one transaction per batch |
| Ack dispatch | asynchronous, 256 in flight (ackAsync=true) |
Each batch’s ack is dispatched on its own task so a consumer does not hold a partition’s lease blocked on its own ack round trip. An ack is never shed; when the semaphore is full the consumer blocks |
| Offered rate | 600,000 msg/s, open loop | Fixed schedule, 64 pacer workers, 6,000 push requests per second |
| Push batch | 100 messages | Amortises per-transaction cost. Batch 1 is a different measurement |
| Payload | 256 bytes | One size, one shape |
| Partitions | 200 | Consumption parallelism per group is bounded by partition count |
| Consumers | 600 closed-loop drainers | Consumers pull; consumer count changes the answer |
| Retention | on, completed messages after 300 s | The reason the database plateaus instead of growing |
| Duration | 86,400 s, reported every 10 s | 8,640 interval lines in the archived stdout |
Result
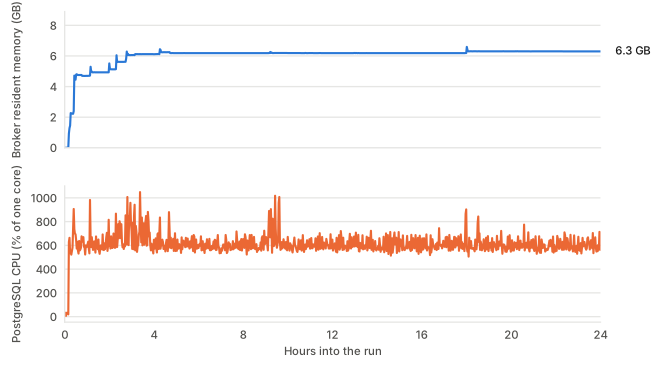
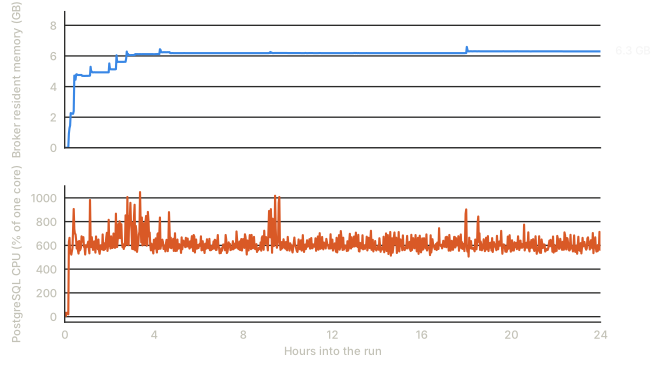
benchmark-queen/2026-07-25-soak24/raw/soak-bench.csv.Straight from the final line of raw/soak24b.out:
| Metric | Value |
|---|---|
| Messages offered | 51,822,007,600 |
| Messages accepted (pushed) | 51,820,403,100 |
| Shed by the loader’s in-flight cap | 0 |
| Messages popped | 51,820,623,201 |
| Messages acked | 51,820,561,201 |
| Failed push requests | 15,742 |
| Failed pop requests | 26 |
| Failed acks | 47,600 |
| Whole-run end-to-end latency | p50 87.55 ms, p99 272.38 ms, p99.9 473.09 ms |
| Average ack round trip | 47.15 ms |
| Restarts, incidents | 0, 0 |
Average accepted throughput is 51,820,403,100 over 86,400 s, or 599,773 msg/s. Per interval, the median achieved rate across all 8,640 samples is 599,980 msg/s, and 600,000 msg/s across the 7,020 samples after the four-and-a-half hour mark.
Popped exceeds pushed by 220,101 messages, or 0.0004%. That is the signature of at-least-once delivery: a lease that expires or an ack that fails redelivers its span, and the consumer counts it again.
Resources
From the 1 Hz host sampler, 87,500 samples, medians over the run after the first fifth:
| Resource | Steady value |
|---|---|
| Broker resident memory | 6,335 MB, maximum 6,888 MB across the whole run |
| Broker CPU | about 14.3 cores of 32 |
| PostgreSQL CPU | about 5.9 cores |
| PostgreSQL commits | about 3,160 per second |
| WAL fsyncs | about 736 per second, about 38 MB/s of WAL |
| Database size | median 18.5 GB, maximum 20.6 GB |
Broker memory is the number this run exists to produce. A leak at this rate would be obvious: at
600,000 messages per second, a per-message overhead of even tens of bytes is gigabytes per hour.
Across the last 19.5 hours the samples span 6,330 MB to 6,875 MB, with a median of 6,336 MB:
a 545 MB band, no trend. The watchdog, sampling every five minutes, recorded restarts=0 on
every line.
The database plateau is retention working. Completed messages leave after 300 s, so steady-state size is set by the retention window and the rate rather than by the run length. After load stopped, the watchdog’s last lines show the database drained to 8,292 MB.
Errors, in time order
The single “error rate 0.00012%” figure is the sum of all three error counters (15,742 plus 26 plus 47,600, or 63,368) over 51,820,403,100 accepted messages. It is worth decomposing, because those counters are not on the same scale and they did not accrue uniformly.
Push and pop errors count failed requests; each push request carried 100 messages. Ack errors count messages. So the message-level statement is different and also worth having: 1,604,500 messages of 51,822,007,600 offered were never accepted, which is 0.0031%, with nothing shed.
Cumulative counters at checkpoints:
| Elapsed | Failed pushes | Failed pops | Failed acks |
|---|---|---|---|
| 1 h | 2,005 | 2 | 23,100 |
| 2 h | 3,655 | 4 | 23,100 |
| 4.5 h | 12,990 | 9 | 32,300 |
| 6 h | 12,990 | 13 | 32,600 |
| 9 h | 13,308 | 14 | 32,600 |
| 12 h | 13,313 | 18 | 46,100 |
| 18 h | 15,739 | 23 | 47,100 |
| 21 h | 15,741 | 26 | 47,600 |
| 24 h | 15,742 | 26 | 47,600 |
82% of the failed pushes happened in the first four and a half hours. Errors did not stop after that, though: 13,500 acks failed between the nine- and twelve-hour marks. The session note’s claim of “zero new errors in the last 14 hours” is not what the stdout shows; the last increment to any counter is at 21.3 hours.
Latency was not flat, and the excursions have a cause
Whole-run p99 is 272 ms, and the median of the per-interval p99 values is 236 ms. But 43 of the 8,640 ten-second intervals (one in 200) reported a p99 above one second, and they cluster:
| Window | Intervals above 1 s | Worst p99 in the window |
|---|---|---|
| 0.1 h – 4.5 h | 36 | 27.7 s |
| 9.0 h – 9.1 h | 4 | 22.9 s |
| 17.8 h – 17.8 h | 3 | 26.3 s |
The first cluster was diagnosed live and fixed during the run. The cause was autovacuum’s
heap-truncation phase on queen.log_partitions and queen.log_consumers, two
fixed-population tables. Truncation takes an ACCESS EXCLUSIVE lock and freezes every push and
pop for seconds while recovering nothing, because those tables do not shrink. It was caught with
pg_stat_progress_vacuum at about the 2.7-hour mark and disabled with
ALTER TABLE … SET (vacuum_truncate = off); the waves that continue to 4.5 hours are a vacuum
already in flight plus the checkpoint cycle settling.
The two later clusters are checkpoint boundaries: PostgreSQL was writing about 10 GB every 15 minutes, close to back to back, and each excursion recovered on its own.
Two lessons in that, and both are operational rather than about Queen. The
vacuum_truncate = off setting on the log engine’s fixed-population tables is load-bearing at
this rate. And max_wal_size wants to be large enough to space checkpoints out. The residual
blips are a checkpoint tuning artifact, not a broker one.
What this run establishes
- No memory leak on the hot path at scale. 24 hours at 600,000 messages per second per side with flat resident memory. Short runs cannot show this; the ceiling run in this same benchmark family found three separate out-of-memory conditions that only appear after about 580 seconds of accumulation.
- Retention reaches a steady state. The database plateaued instead of growing, across roughly 17,000 sweep cycles, and drained when load stopped.
- Explicit acknowledgement is affordable at this rate. Leases plus an offset commit per batch sustained the same 600,000 per second per side, at about 14 cores of broker CPU and 6 cores of PostgreSQL.
- PostgreSQL is the ceiling, and it is a commit ceiling. About 3,160 commits per second and
736 WAL fsyncs per second on storage with roughly 95 µs
fdatasync.
What it does not establish
- Not a per-message completeness proof. The open-loop loader counts aggregates: offered, accepted, popped, acked. It does not assign a sequence number per message and check the set on arrival, so “zero loss” is not one of this run’s findings. The run that does per-message accounting is the ordered pipeline, and the run that does per-tenant bitmaps is the multi-tenant cell.
- Not an ordering proof. No verifier ran. Ordering was verified separately.
- Nothing about high availability. One broker, no mesh, no peer.
- Nothing about failure. No PostgreSQL restart, no failover, no broker kill, no consumer churn. The disk spool was never exercised.
- Nothing about the proxy, tenancy, quotas or rate limits. The loader spoke to the broker directly.
- One workload shape. 256-byte payloads, push batch 100, 200 partitions, one queue, one consumer group. Batch 1, large payloads and wildcard consumption are all materially different measurements.
- Fast storage. At about 95 µs per
fdatasync, this figure is not disk-bound. The session note records that the disk plateaus at roughly 600,000 to 650,000 per second, which is why this run was configured at 600,000 rather than higher.
Files
| File | Contents |
|---|---|
raw/soak24b.out |
The loader’s stdout: 8,640 ten-second interval lines and the final aggregate |
raw/soak-bench.csv |
1 Hz sampler on the broker host: broker and PostgreSQL CPU and memory, commits, WAL, database size, wait events |
raw/soak-loader.csv |
1 Hz sampler on the loader host, including network throughput |
raw/soak-watchdog.log |
Five-minute health lines with the restart counter |
results.md |
The session note. Written in Italian, and see the two corrections above |
queen-soak24-report.png |
Six panels over the 24-hour axis |
To run something of this shape yourself, see Reproducing these runs.