
A four-stage pipeline over 1000 partitions, running 25,000 events per second for 600 seconds, delivered 88,503,408 messages that a per-stage verifier confirmed as 0 duplicates, 0 gaps and 0 order violations. The deduplication window was 300 seconds, acknowledgement was explicit, and no acknowledgement failed during the run. That matters, because it puts the verifier’s ordering check in its strict mode.
This is the run that tests the central design claim. Queen promises total order per partition, in
commit order, and nothing else; a pipeline where each entity owns a partition and every stage
re-emits into the next is the shape where a violation of that promise would show up. The artifact
is benchmark-queen/2026-07-23-3test-report/raw/t3.out (test T3), and the verifier verdict is
printed at the end of that file.
The topology
Two flows over the same 1000 entities. Each entity (a “property”, in the channel-manager workload this models) owns one partition in every queue, so entity order and partition order are the same thing.
| Flow | Ingress queue | First stage | Derived queue | Fan-out |
|---|---|---|---|---|
| Availability | cm-avail |
cm-db consumer group applies the update |
cm-ota-sync |
5 consumer groups (ota-1 … ota-5) |
| Prices | cm-prices |
cm-cal consumer group recomputes |
cm-ota-prices |
5 consumer groups (otap-1 … otap-5) |
Four queues, 1000 partitions each, twelve verified streams: the two intermediate stages plus the ten fan-out groups. Ingress is 12,500 events per second per flow, pushed one message per request: no producer batching, which is the harder and more realistic ingress shape. Each first-stage consumer sleeps 10 to 30 ms to simulate work, then emits its derived messages for a property as a single batched push, because the order of the array is the order of the append and the server-side append is atomic.
goload -mode cm -> properties=1000 rate-events=25000 (A=12500 B=12500) ramp=15s duration=600s
  pop-batch=100 pop-partitions=10 pop-wait=true push-shards=1000/flow
  queues: dedupWindow=300s completedRetention=300s leaseTime=60s
Consumption is wildcard: consumers pop at the queue level and claim up to 10 partitions per call rather than being pinned to a partition. This is the general case and the expensive one: the broker has to find claimable partitions rather than being told which one.
A warm-up phase pushes sequence 0 for every property in both flows before the pacer starts, and drains the pipeline. That is not cosmetic: in production the entities already exist, and creating 4000 partitions cold under full load is a measured wedge.
How the verification works
This is the part worth reading carefully, because “0 order violations” is only as strong as the check behind it.
Ground truth. Each producer assigns every message a monotone per-property sequence number
and records the highest sequence it assigned per property in a produced.meta file.
Observation. Every consumer at every stage appends one line per received message to a log
file named for its (queue, group) pair: the property id and the sequence number, nothing else.
Twelve stages means twelve log files.
Checking. The verifier streams each stage log and keeps per property the set of sequence numbers seen, the highest first-occurrence sequence so far, and the highest sequence seen at all. From those it derives four counts:
| Count | Definition | Verdict weight |
|---|---|---|
| duplicates | a sequence number arriving again after its first occurrence | Reported. Expected under at-least-once delivery |
| order violations | a first occurrence whose sequence is lower than the highest first-occurrence already seen for that property | Fatal when no acknowledgement failed during the run |
| gaps | per property, the expected span maxSeen − baseSeq + 1 minus the number of distinct sequences seen, clamped at zero |
Always fatal |
| in flight | per property, the produced maximum minus the highest sequence seen | Reported, never fatal |
The gap definition is the loss test, and its logic is the reason it is sound. Every sequence
recorded is distinct and lies between the base sequence and the highest one seen, so the expected
span is maxSeen − baseSeq + 1, and any shortfall against the number actually seen is a sequence
that never arrived even though a higher one did. A message still in flight at the cutoff cannot
produce a gap, because it is above maxSeen; it lands in the in-flight column instead. That is
what “gaps below the frontier” means.
Two subtleties in the implementation are worth knowing:
- A duplicate is counted and then skipped for the ordering check. Redelivery is legitimate, so re-seeing sequence 7 after sequence 12 must not be reported as reordering; only a first occurrence out of order is.
- The per-property gap term is clamped at zero before summing. Without the clamp, a negative term from one property could cancel a genuine gap in another and flip an aggregate failure to a pass. An unsound verifier is worse than no verifier.
The strict-mode condition. An order violation is fatal unless acknowledgements failed
during the run, because a failed ack legitimately redelivers a span and a redelivery can reorder
first occurrences. This run recorded ackErr=0, so the ordering check ran with no such
exemption available: any violation at all would have failed it.
The verdict
benchmark-queen/2026-07-23-3test-report/raw/t3.out.The last block of raw/t3.out:
stage(queue_group)               msgs     unique     dups     gaps    viols   inflight  verdict
cm-avail_cm-db                7379349    7379349        0        0        0      27993  PASS
cm-prices_cm-cal              7375023    7375023        0        0        0      32228  PASS
cm-ota-sync_ota-1             7377245    7377245        0        0        0      30097  PASS
cm-ota-sync_ota-2             7376882    7376882        0        0        0      30460  PASS
cm-ota-sync_ota-3             7376173    7376173        0        0        0      31169  PASS
cm-ota-sync_ota-4             7376503    7376503        0        0        0      30839  PASS
cm-ota-sync_ota-5             7377370    7377370        0        0        0      29972  PASS
cm-ota-prices_otap-1          7372710    7372710        0        0        0      34541  PASS
cm-ota-prices_otap-2          7373102    7373102        0        0        0      34149  PASS
cm-ota-prices_otap-3          7373159    7373159        0        0        0      34092  PASS
cm-ota-prices_otap-4          7373210    7373210        0        0        0      34041  PASS
cm-ota-prices_otap-5          7372682    7372682        0        0        0      34569  PASS
TOTAL                        88503408   88503408        0        0        0     384150
VERDICT: PASS  (0 gaps below frontier, 0 order-violations, 0 dups, 384150 in-flight at cutoff)
msgs equals unique on every row, which is the zero-duplicate statement stated twice. The
384,150 in-flight messages are the tail: work produced in the last seconds that had not reached
every fan-out group when the cutoff fell.
The loader’s own final line for the same run:
[final] producedA=7406175 producedB=7406075 | db=7379349 cal=7375023 ota=36884173 otap=36864863
        acked=88502190 ackErr=0 pushErr=2096 pushRetry=0 shed=0
What it cost to run
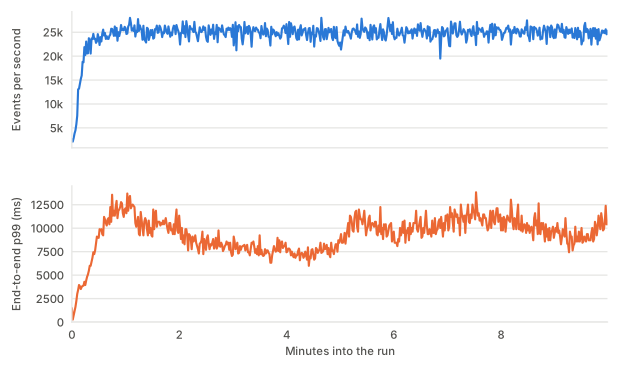
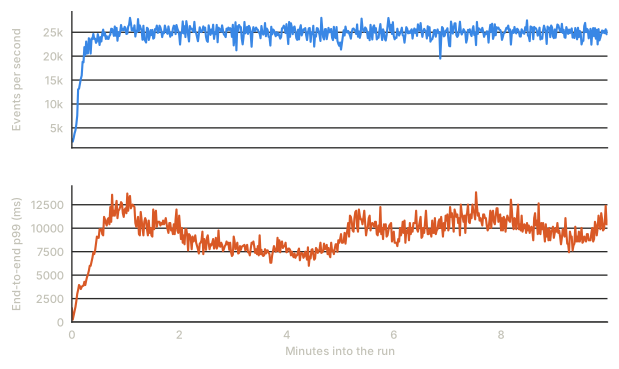
Measured across the 480 one-second intervals after the ramp and pipeline fill:
| Quantity | Steady value |
|---|---|
| End-to-end events completing per second | median 25,114 (range 19,495 – 28,013) |
| Acks per second across all stages | median 151,000 |
| End-to-end p50 | median 1,712 ms (range 1,253 – 2,212) |
| End-to-end p99 | median 9,372 ms (range 5,997 – 13,828) |
| Ingress backlog, availability flow | median 24,000 messages |
| Ingress backlog, prices flow | median 29,000 messages |
The latency figures need their measurement point attached, and it is an unusual one. This is end-to-end across the whole multi-hop pipeline, measured from the producer’s scheduled instant to the last fan-out group receiving the derived message, so it contains two queue waits, two pop cycles, and the simulated 10 to 30 ms of work per hop, times the number of hops. It is not a broker latency and must not be compared with the broker-side or push-to-pop figures on the other pages in this section. Two seconds of p50 for a four-stage pipeline with deliberate work sleeps at each stage is the pipeline’s latency, not the broker’s.
At the message level the run sustains roughly 350,000 message-operations per second: about 50,000 pushes per second (25,000 single ingress plus 25,000 derived, batched), about 150,000 pops and about 150,000 acks. PostgreSQL used about 19 cores and the broker about 7, with about 14,000 commits per second and the database plateauing near 8 GB under retention.
Where it stops
At 35,000 events per second the ingress still holds (about 36,000 single pushes per second), but intermediate consumption saturates near 29,000 events per second, and the ingress backlog then grows linearly. The structural cost is the wildcard candidate scan under allocator churn: when partitions and consumer rows are being updated tens of thousands of times a second, finding claimable partitions gets more expensive. 25,000 events per second is the sustainable point with margin, and that is why the certified run is at 25,000 and not higher.
Two real bugs this run found
Reaching this result required fixing the broker, not tuning the loader, and both fixes are in the stored procedures that ship today.
A livelock on mass partition creation. ON CONFLICT DO NOTHING against a key currently being
inserted by another open transaction waits on that transaction’s id until it commits. With
wildcard pops evaluating multiple candidate partitions in random order, those waits chained: over
200 backends parked on Lock:transactionid, pop transactions minutes old, commits per second
collapsing to nearly zero, and no cycle, so PostgreSQL’s deadlock detector had nothing to say.
Two changes fixed it. 042_log_push.sql now orders the provisioning inserts on the unique key, so
concurrent creators queue in one direction instead of crosswise. And log_pop_v1 in
043_log_pop.sql wraps the lazy creation of the consumer row in a non-blocking
pg_try_advisory_xact_lock guard: one caller creates it, the others skip the attempt and come
back rather than waiting.
Index churn under high update rates. At more than 30,000 updates per second, the wildcard
candidate scans over log_partitions and log_consumers degraded from about 2 ms to 12–35 ms as
dead tuples accumulated between autovacuum passes. 041_log_schema.sql now sets
threshold-based autovacuum reloptions on both tables. The 24-hour soak
found the other half of the same story: heap truncation on those two fixed-population
tables must be disabled.
What this run does not establish
- Not a throughput result. 25,000 events per second here is a sustainable point for this topology with work sleeps, not a ceiling. For the ceiling see Throughput ceiling.
- Not a durability result. No failure was injected, no broker restarted, no PostgreSQL interruption.
- No global ordering claim. The verifier checks order per property, which is to say per partition. Queen makes no cross-partition ordering promise and this run does not test for one.
- Ordering under nacks is untested here.
ackErrwas zero, so the verifier’s redelivery exemption was never used. A run where acks fail would legitimately show reordered first occurrences. - A 600-second window. Long enough to fill the pipeline and reach steady state, not long enough to say anything about accumulation.