
Two results here, both about a cell: PostgreSQL, the proxy’s own state database, the broker and the proxy sharing one CPU-capped control group, which is how a small hosted tenant is actually served. A free-tier shape is two cores covering all four processes. The load generator runs on the same machine but outside the cap, and is billed separately, because a loader that borrows the cell’s cores flatters the result.
A 2-core cell held above 2400 msg/s through the proxy with zero loss and no stall. Separately, twelve tenants sharing one queue and one consumer group ran for an hour with zero cross-tenant deliveries. Both were measured with deduplication off and with 429 retry disabled in the loader, and the hour-long run’s aggregate verdict from the loader’s own checker is FAIL. All of that is unpacked below.
The host was 8 vCPU / 15 GiB with NVMe, fdatasync averaging 95.5 µs with a p99 near 396 µs.
The broker carried the hot-list re-arm cap and the ownership-gate cache; the proxy carried
tokio-pool sizing to the cgroup quota (commits ccfb844, 1ad3d5e, 301c9bc).
The throughput ladder
Four tenants sharing queue orders and consumer group workers, 8 partitions, explicit
acknowledgement, 40 seconds of load and 15 seconds of drain per point, the database dropped and
the broker restarted before every point. Cell CPU is the queencell.slice usage_usec delta, so
it counts the cell and nothing else. Per-message delivery was verified on every point: a point
without a passing delivery check was not reported as a throughput number at all.
| Offered | Achieved push / pop | Cell CPU | Commits per delivered message | End-to-end p99 | Loss |
|---|---|---|---|---|---|
| 500 | 500 / 500 | 1.22 cores | 3.03 | 210 ms | 0 |
| 700 | 700 / 700 | 1.71 cores | 3.03 | 25 ms | 0 |
| 900 | 900 / 900 | 2.01 cores | 2.75 | 69 ms | 0 |
| 1100 | 1100 / 1099 | 2.01 cores | 2.15 | 86 ms | 0 |
| 1300 | 1300 / 1300 | 2.01 cores | 1.73 | 159 ms | 0 |
| 1500 | 1500 / 1499 | 2.02 cores | n/a | 216 ms | 0 |
| 2000 | 2000 / 1996 | 2.02 cores | n/a | 461 ms | 0 |
| 2400 | 2400 / 2395 | 2.02 cores | n/a | 741 ms | 0 |
The 210 ms at the 500-point is a first-run warm-up outlier, from a cold ring and cold cursors; the 700-point’s 25 ms is the same configuration warm.
Two direct-to-broker control points at the same cap, with the proxy out of the path: 900 offered
at 1.81 cores and 43 ms p99, 1100 offered at 2.02 cores and 61 ms p99. The proxy’s cost over
direct is +0.16 cores at 500 and +0.20 cores at 900, roughly 100 to 160 µs per request, which
perf attributes to no single hotspot but to terminating and re-originating HTTP: four socket
syscalls per request, tokio scheduling, and hyper on both sides.
What the ladder shows about the shape of saturation is more useful than the ceiling number. The cell pins at 2.0 of its 2 cores from about 900 msg/s upward, and yet achieved throughput keeps tracking offered all the way to 2400. That is not free capacity appearing; it is commits per delivered message falling from 3.03 to 1.73 as backlog builds, because a pop under backlog returns a full batch and a batch amortises its transaction. Latency is the pressure valve: p99 grows from 25 ms to 741 ms across the same range. Loss stays zero and nothing stalls. That is honest backpressure: the failure mode past the knee is bounded latency growth, not loss.
For context on the size of the change: the same free-tier shape measured in July, broker-only with no proxy in the path, ceilinged near 500 msg/s. That earlier figure is not published as a Queen number because it measured a different thing. See the closing section of Benchmarks.
The one-hour twelve-tenant soak
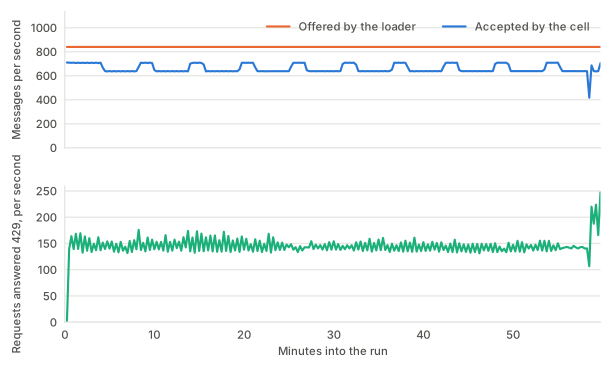
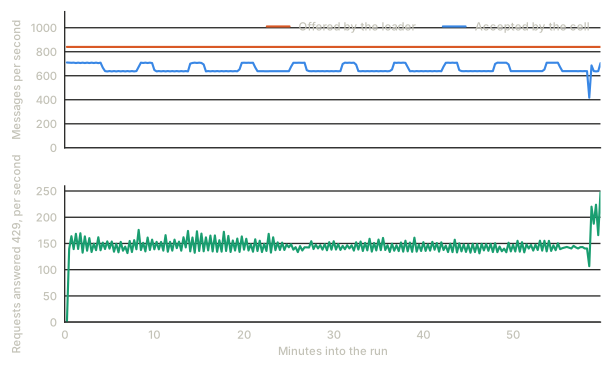
benchmark-queen/2026-07-30-1h-soak/loader-interval.csv.This run answers a different question: does a shared cell keep tenants apart, for an hour, while all three enforcement mechanisms are actively firing?
Twelve tenants, all on the same queue name and the same consumer group name, which is the
shape that stresses every in-process structure keyed by queue: the hot-list ring, the parked-pop
wake gates, the queue-configuration caches. 3600 seconds of load through the proxy. The
configuration is recorded verbatim in soak1h.json:
| Parameter | Value |
|---|---|
| Tenants | 12, shared queue orders, shared group workers |
| Offered | 840 msg/s total, 70 per tenant, push batch 1 |
| Consumers | 3 per tenant, pop batch 50, long poll with a 5000 ms timeout |
| Acknowledgement | explicit (autoAck: false), lease 30 s |
| Partitions | 8 |
| Payload | 256 bytes |
| Deduplication | off (dedupWindowSeconds: 0) |
| 429 handling | retry disabled (retry429Attempts: 1) |
| Client retries | 0 |
| Retention | completed after 300 s, pending after 3600 s |
| Target | the proxy, with enforcement on |
Three tenants were deliberately abused so enforcement would fire continuously. soak-0000 and
soak-0001 were forced onto the free plan’s limits (5 requests and 20 messages per second) and
spent the hour being rate-limited. soak-0002 was given a 768 KiB retained-bytes quota, which
trips, then releases as retention frees bytes 300 seconds later, then trips again: about ten
cycles over the hour.
The isolation result
| Metric | Value |
|---|---|
| Cross-tenant deliveries | 0 |
| Messages offered | 3,024,001 |
| Messages accepted | 2,376,180 |
| Messages delivered | 2,400,397 |
| Messages acked | 2,350,538 |
| Shed by the loader | 0 |
Nine tenants were never touched by the three being throttled and blocked. Each of the nine had between 251,564 and 251,575 messages accepted, received between 251,567 and 251,582, and recorded 0 missing with between 3 and 8 duplicates, about 0.002%, which is ordinary at-least-once redelivery. Noisy-neighbour containment is what that row means.
The aggregate verdict is FAIL, and here is why
The loader’s own checker reports verdict: FAIL for the run: 25,157 missing and 49,374 duplicates
across 2,400,397 deliveries. Decomposed by tenant:
| Class | Tenants | Accepted, of 252,000 offered each | Missing | Duplicates |
|---|---|---|---|---|
| healthy | the nine untouched tenants | about 251,570 each | 0 | 52 total |
| rate-limited | soak-0000, soak-0001 |
13,778 and 14,610 | 12,612 and 12,545 | 24,433 and 24,886 |
| quota-blocked | soak-0002 |
83,695 | 0 | 3 |
All of the missing and 99.9% of the duplicates belong to the two tenants throttled to about one
fourteenth of their offered rate. With retry429Attempts: 1 the loader does not retry a
rate-limited request at all, so a throttled tenant must end the hour with undrained backlog:
those messages were never accepted, and the checker counts an assigned sequence that never
arrived as missing. Its duplicates come from the same place: when a rate-limited consumer’s
acks are refused, the lease expires and the span is redelivered, correctly.
So the broker and the proxy behaved as specified, and the checker does not model enforcement-induced backlog or enforcement-induced redelivery. That is the honest reading, and it is why the publishable claim from this run is the isolation result and the nine-tenant zero-loss result rather than a delivery ratio.
The quota-blocked tenant is the clean case, and worth stating separately: every message the quota admitted was delivered, with zero missing.
Errors the sampler recorded
| Error | Count | What it means |
|---|---|---|
HTTP 429 rate_limited |
527,472 (474,861 push, 50,968 pop, 1,643 ack) | The limiter working, on the abused tenants |
HTTP 403 storage_quota_exceeded |
167,873 | The quota working, on soak-0002 |
HTTP 502 bad_gateway |
818 (713 push, 78 pop, 27 ack) | The proxy could not reach the broker |
| connection refused | 4,392 (4,374 push, 18 ack) | The proxy itself was not accepting connections |
| pop timeout | 6,620 | A long poll reaching its 5000 ms deadline with nothing to serve |
The 429s and the 403s are the point of the run. The 818 gateway errors and 4,392 refused connections are not, and they have to be stated rather than netted out: for part of this hour the proxy, or the broker behind it, was unavailable.
The interval series locates it precisely. Every one of those 5,210 errors landed in a single 15-second interval, at t=3510 s, 90 seconds before the end of the load phase. In that interval the push rate fell from about 638 to 417 msg/s, the pop rate from about 640 to 196 msg/s, and push p99 jumped from 56 ms to 1,368 ms. Thirty seconds later the pop rate had surged to 1,254 msg/s, cleared the backlog, and the run finished normally. So it was one brief interruption with full recovery rather than a degraded hour, but the archive does not record its cause, and this page will not invent one.
Resources and broker-side latency
| Quantity | Value |
|---|---|
| Cell CPU | median 1.87 cores against the 2-core cap, maximum 2.19 |
| Broker resident memory | 46 MB, flat all hour; 33 MB once load stopped |
| Broker-side p99, push | median 2.86 ms across 360 under-load samples, maximum 57.9 ms |
| Broker-side p99, pop | median 2.75 ms, maximum 64.9 ms |
| Hot-list wheel depth | median 635, maximum 737: bounded, not growing |
| Push round trip | p50 1.59 ms, p99 56.1 ms |
| Ack round trip | p50 1.35 ms, p99 6.24 ms |
| End to end, whole run | p50 6.30 ms, p95 59.6 ms, p99 133,693 ms |
That last row is the clearest example on this site of why broker-side and end-to-end p99 must never be quoted interchangeably. The broker spent a median of 2.86 ms on the pushes it accepted; the end-to-end p99 is over two minutes, because the two rate-limited tenants’ delivered messages sit in the same histogram and had been waiting since they were scheduled. The interval series reports that same coarse latency bucket in nearly every interval for exactly this reason. Neither number is wrong. A page quoting only one of them would mislead in one direction or the other.
Metering
The proxy meters what it bills. At the end of the hour its metered push-message total was 2,376,180 (exactly the loader’s count of accepted pushes) and its metered delivery total was 2,399,280 against the loader’s 2,400,397 delivered, the difference being the sampler stopping one interval before the loader did. Read requests carry zero messages, correctly.
The push-to-delivery gap
2,400,397 messages were delivered against 2,376,180 accepted: 1.02% more deliveries than pushes. That is redelivery, not duplicated stored data. Every one of those extra deliveries is a leased span whose ack failed or whose lease expired, coming back exactly as at-least-once delivery specifies. The nine healthy tenants contribute 52 of them; the rest belong to the two tenants whose acks were being refused.
What these runs establish
- Tenant isolation holds under the worst shared-name shape, for an hour, with the hot-list ring, the wake gates and the caches all keyed by tenant: zero cross-tenant deliveries across twelve tenants on one queue and one consumer group.
- Noisy neighbours are contained. Three tenants pinned against their limits for an hour cost the other nine nothing measurable: zero missing messages each.
- Enforcement is real and observable. Over half a million rate-limit refusals and 167,873 quota refusals, with the quota oscillating as retention frees bytes.
- A two-core cell has a usable ceiling above 2400 msg/s through the proxy, degrading gracefully past the knee: bounded latency growth, zero loss, no stall.
- Metering is exact against the loader’s own counters.
What they do not establish
- Nothing about high availability. Single broker. The mesh frames carry a tenant now, but multi-broker shared-cell throughput under these fixes is unmeasured.
- Not a delivery-ratio result. The aggregate verdict is FAIL for the reasons above, and the publishable delivery claim is scoped to the nine unthrottled tenants.
- Not a long soak. One hour. The 24-hour evidence on this site is the single-tenant soak, which had no proxy in the path.
- Deduplication off. Nothing here measures the cost of exact deduplication on a shared cell.
- A client that handles 429 properly was not measured. Retry was disabled deliberately so
enforcement would be visible in the accounting. A client backing off on
Retry-Afterwould show a very different delivery profile. - One workload shape. Push batch 1, pop batch 50, 256-byte payloads, 8 partitions.
Files
| File | Contents |
|---|---|
2026-07-30-1h-soak/soak1h.json |
The loader’s final run record: full configuration, per-tenant delivery verdict, errors by kind and by HTTP code, latency histograms |
2026-07-30-1h-soak/loader-interval.csv |
15-second interval series: throughput, latency, errors |
2026-07-30-1h-soak/vm-sampler.csv |
Cell sampler: CPU, PostgreSQL commits, connections, metered usage, broker resident memory |
2026-07-30-1h-soak/broker-rates-sizes.log |
The broker’s own rates and sizes blocks: server-side latency, pool, hot-list |
2026-07-29-vm-campaign/results.md |
The campaign record, including the ladder above. Written in Italian |
2026-07-29-vm-campaign/*.sh |
The rig and per-point scripts |
benchmark-queen/vm-cell.sh |
Builds the cell in either shape: --cell-cpus 2 --cell-mem 8 for free-tier, --cell-cpus 0 for uncapped |
To build a cell like this yourself, see Reproducing these runs.