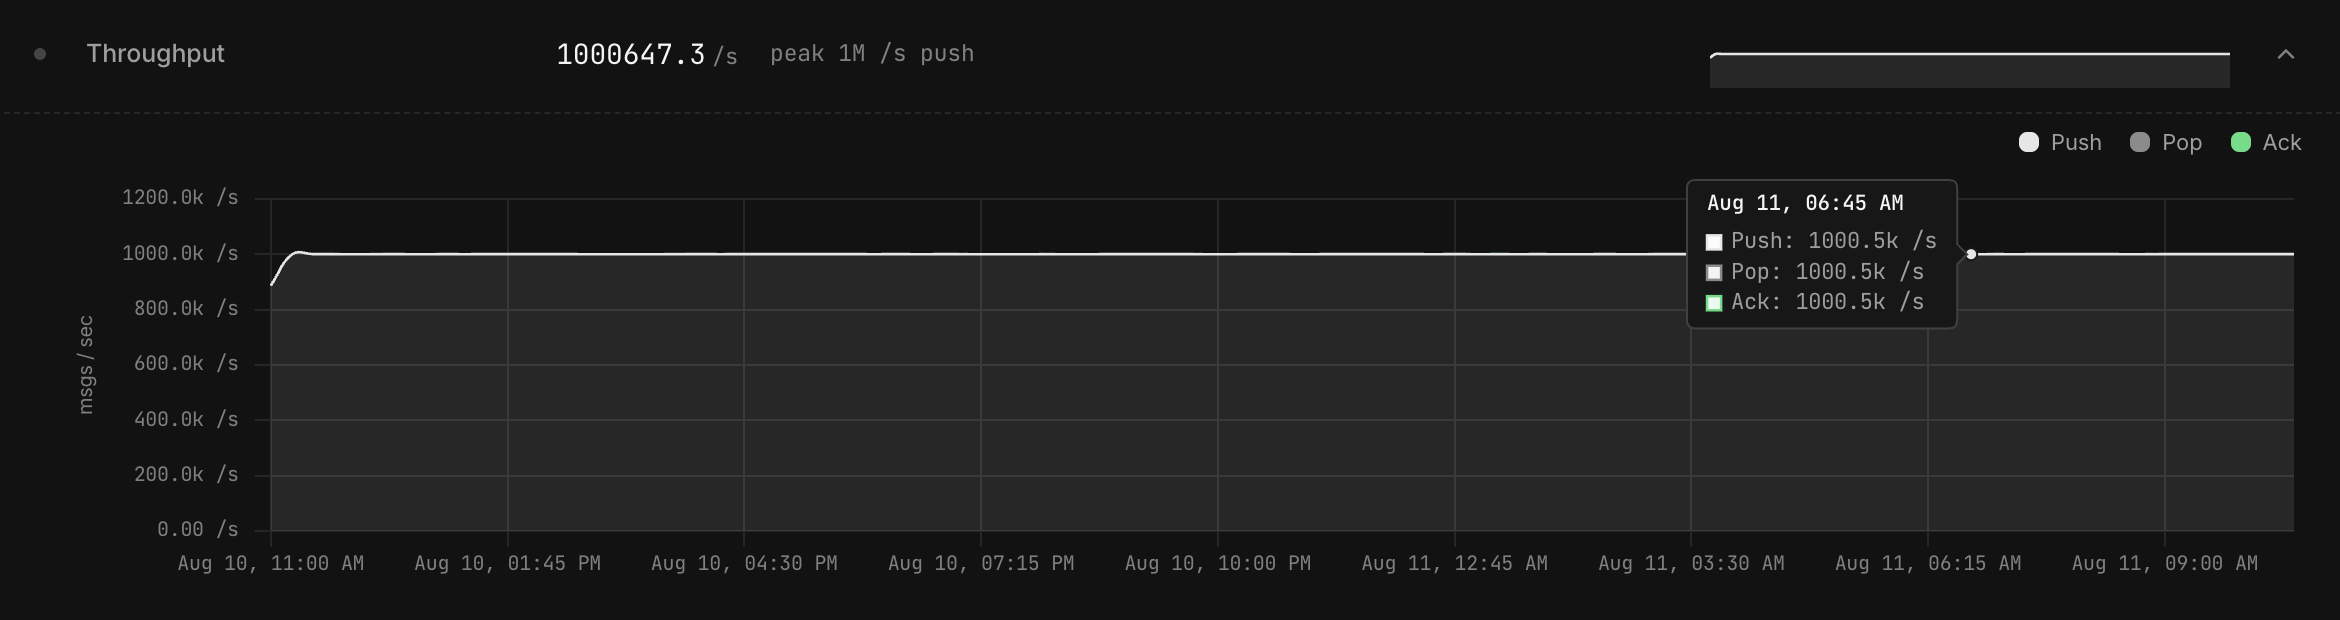
In 24 hours one broker against one PostgreSQL moved 86,369,975,300 messages, about 1,000,000
per second in each direction, with leased pops, explicit acknowledgement, deduplication and
retention all on, zero restarts, and resident memory flat at roughly 4.1 GB. Queen 1.0.0 on a
32 vCPU / 62 GiB machine, artifacts in benchmark-queen/2026-08-11-soak24-1M/.
Configuration
Three loader hosts offered 333,334 and 333,333 and 333,333 messages a second: one 48-core loader tops out near 950,000 on the pop side and becomes the measurement. Each printed its configuration.
goload -mode openloop -> queue=segbench partitions=200 consumers=200 manualAck=true ackAsync=true ackInflight=256
  offered: rate=333334 msg/s | push-batch=100 -> 3333.3 req/s across 64 pacer workers | max-inflight=20000 | payload=256B
[configure] queue=segbench completedRetentionSeconds=300
Beyond that line: pop batch 1,000, deduplication on with a 60-second window, pending retention 3,600 s, 86,400 s of load after a 60 s ramp.
Result
From the final lines of raw/loader-0*/g.out, summed:
| Metric | Value |
|---|---|
| Messages offered | 86,370,017,100 |
| Messages accepted (pushed) | 86,369,975,300 |
| Shed by the loaders’ in-flight cap | 0 |
| Messages popped | 86,369,532,700 |
| Messages acked | 86,369,517,700 |
| Failed push requests | 4 |
| Failed pop requests | 0 |
| Failed acks | 600 |
| Whole-run end-to-end latency | p50 88.6 to 100.9 ms, p99 284.7 to 313.3 ms, p99.9 383.0 to 419.8 ms |
| Average ack round trip | 84.0 to 95.4 ms |
| Restarts, incidents | 0, 0 |
That is 999,652 msg/s including the ramp. Popped trails pushed by 442,600 messages, 0.0005%: residue in flight when the loaders stopped, not loss. Push and pop errors count requests of 100 messages, ack errors count messages: 1,000 messages met an error of any kind, and 41,800 offered were never accepted, 0.000048%.
Hour after hour
Per hour, from the broker’s own counters, throughput never leaves a band of 0.02%:
| Hour | Push/s | Hour | Push/s | Hour | Push/s |
|---|---|---|---|---|---|
| 1 | 999,856 | 9 | 999,888 | 17 | 1,000,114 |
| 2 | 1,000,015 | 10 | 1,000,197 | 18 | 1,000,005 |
| 3 | 1,000,171 | 11 | 999,787 | 19 | 1,000,132 |
| 4 | 999,798 | 12 | 1,000,064 | 20 | 999,821 |
| 5 | 1,000,205 | 13 | 999,957 | 21 | 1,000,050 |
| 6 | 999,817 | 14 | 999,979 | 22 | 999,930 |
| 7 | 1,000,194 | 15 | 1,000,006 | 23 | 1,000,015 |
| 8 | 999,925 | 16 | 999,968 |
One of 1,401 one-minute windows falls outside plus or minus five percent: the ramp.
Latency
Over 8,643 thirty-second reports:
| Reported percentile | Median | p90 | p99 | Worst single interval |
|---|---|---|---|---|
| p50 | 92.7 ms | 106.0 ms | 117.2 ms | 160.8 ms |
| p99 | 288.8 ms | 325.6 ms | 358.4 ms | 593.9 ms |
| p99.9 | 383.0 ms | 432.1 ms | 489.5 ms | 856.1 ms |
No 30-second interval reported a p99 above one second.
Resources
1 Hz host sampler, 86,417 samples:
| Resource | Value |
|---|---|
| Broker resident memory | mean 4.10 GB, maximum 4.37 GB |
| Broker CPU | mean 10.92 cores of 32, maximum 12.90 |
| PostgreSQL CPU | mean 11.54 cores, maximum 13.88 |
| Active backends | 43 |
| PostgreSQL commits | 8,056 per second |
| WAL | 83 MB/s, 6.8 TB over the run |
| WAL fsyncs | 598 per second, 714 µs each |
| Database size | 29.6 GB to 31.4 GB, 31.2 GB at the end |
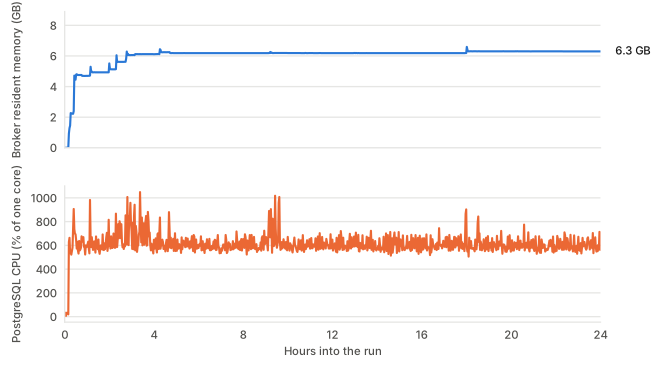
benchmark-queen/2026-08-11-soak24-1M/raw/bench/bench.csv.Memory is the number this run exists to produce: at this rate, tens of bytes per message would be gigabytes an hour. The database plateau is retention working.
What it does not establish
- Not a completeness or ordering proof. The loader counts aggregates, not sequence numbers, and no verifier ran: that is the ordered pipeline.
- Nothing about failure, high availability or the proxy. One broker, no peer, no failover, no consumer churn, no tenancy, and the disk spool was never exercised.
- One workload shape. Batch 1, large payloads and wildcard consumption are different measurements.
- A compressible payload. 83 MB/s of WAL is 83 bytes per message, envelope included; high-entropy data writes several times that.
- Fast storage. About 70 µs per
fdatasync: this figure is not disk-bound.