Every broker serves a dashboard on its own port, with nothing to deploy: the built single-page application is compiled into the binary and read out of the executable at request time.
open http://localhost:6632/The bundle is fixed at build time. There is no static-directory override, mounting a volume
changes nothing, and queen_proxy embeds the same build, so a proxy and the broker behind it
serve the identical dashboard. It is the router’s fallback, registered after every real route,
so a missing path under /api/ or /auth/ still answers a JSON 404 instead of the HTML shell.
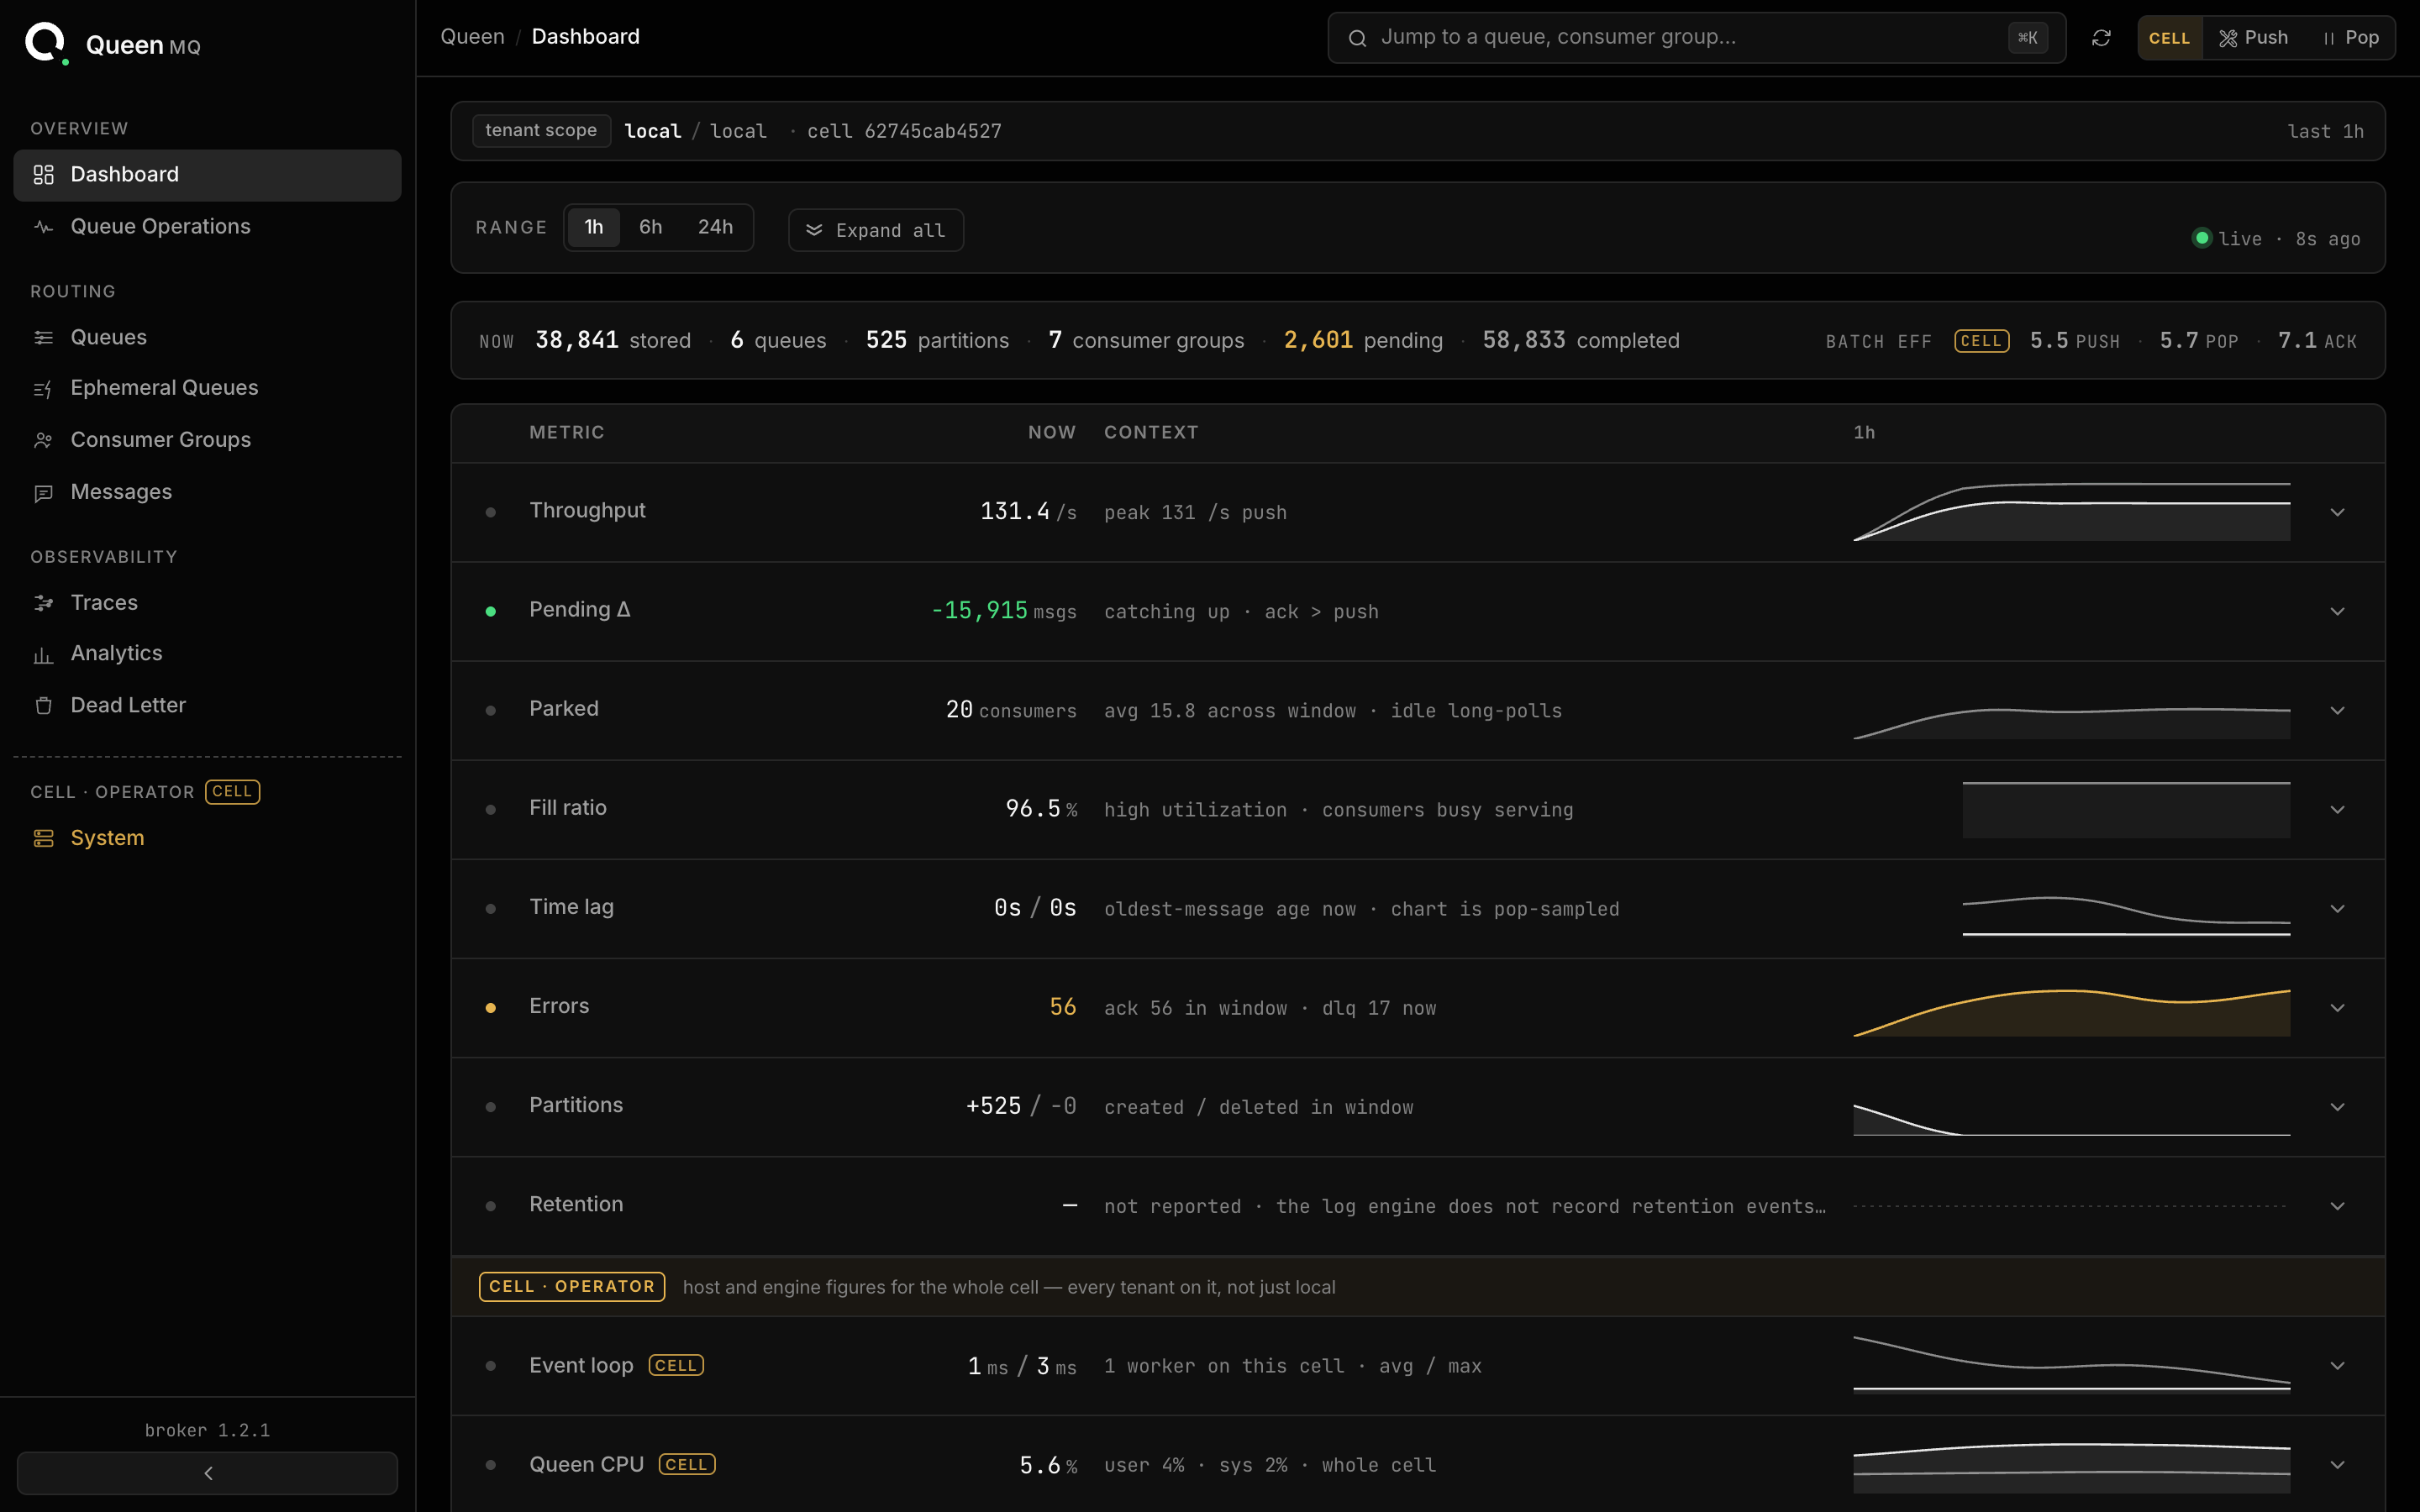
The views
Every view is tenant-scoped except System, and the exception is labelled on screen.
- Dashboard,
/: the resource overview, namespaces and tasks - Queue Operations,
/operations: per-queue throughput, lag and consumer health - Queues,
/queuesand/queues/:queueName: the list, one queue’s configuration, delete - Consumer Groups,
/consumers: lag, the lagging list, subscription changes, seek, delete - Messages,
/messages: listing, single-message inspection, delete - Traces,
/traces: the trace names that exist, and the timeline for one - Analytics,
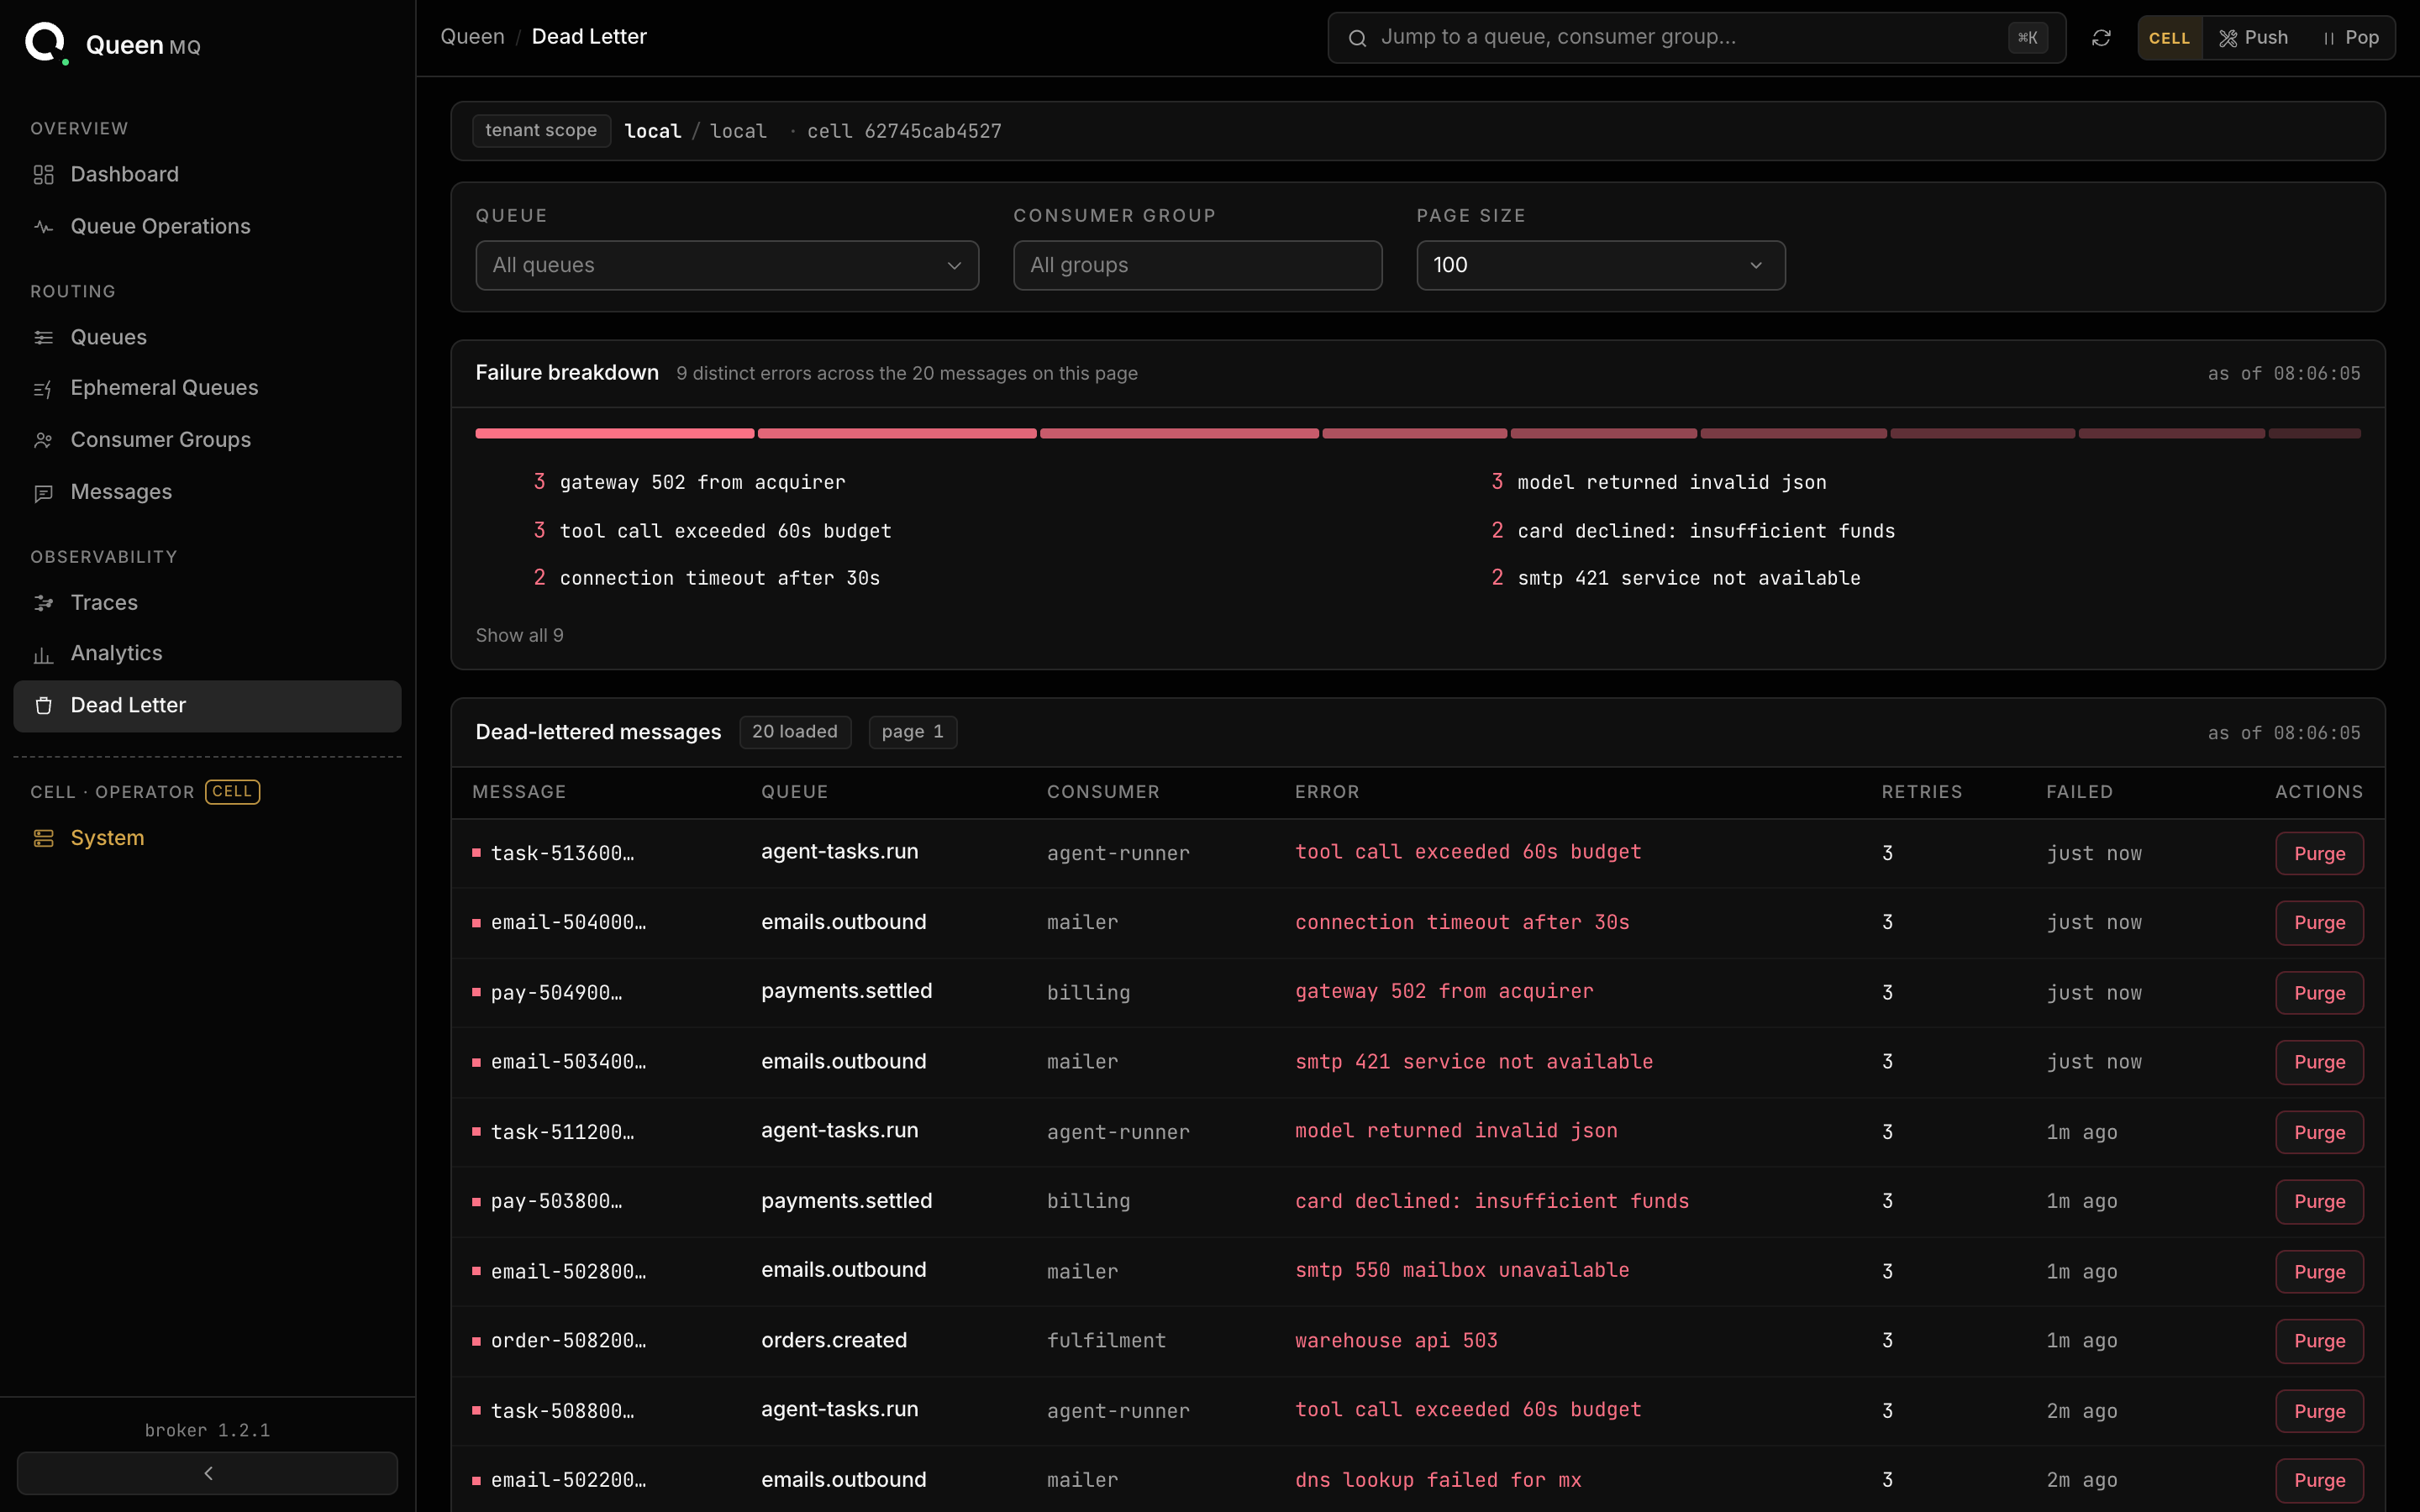
/analytics: status over time, lag and ops series, retention volume - Dead Letter,
/dlq: the dead-letter listing, with per-row purge - System,
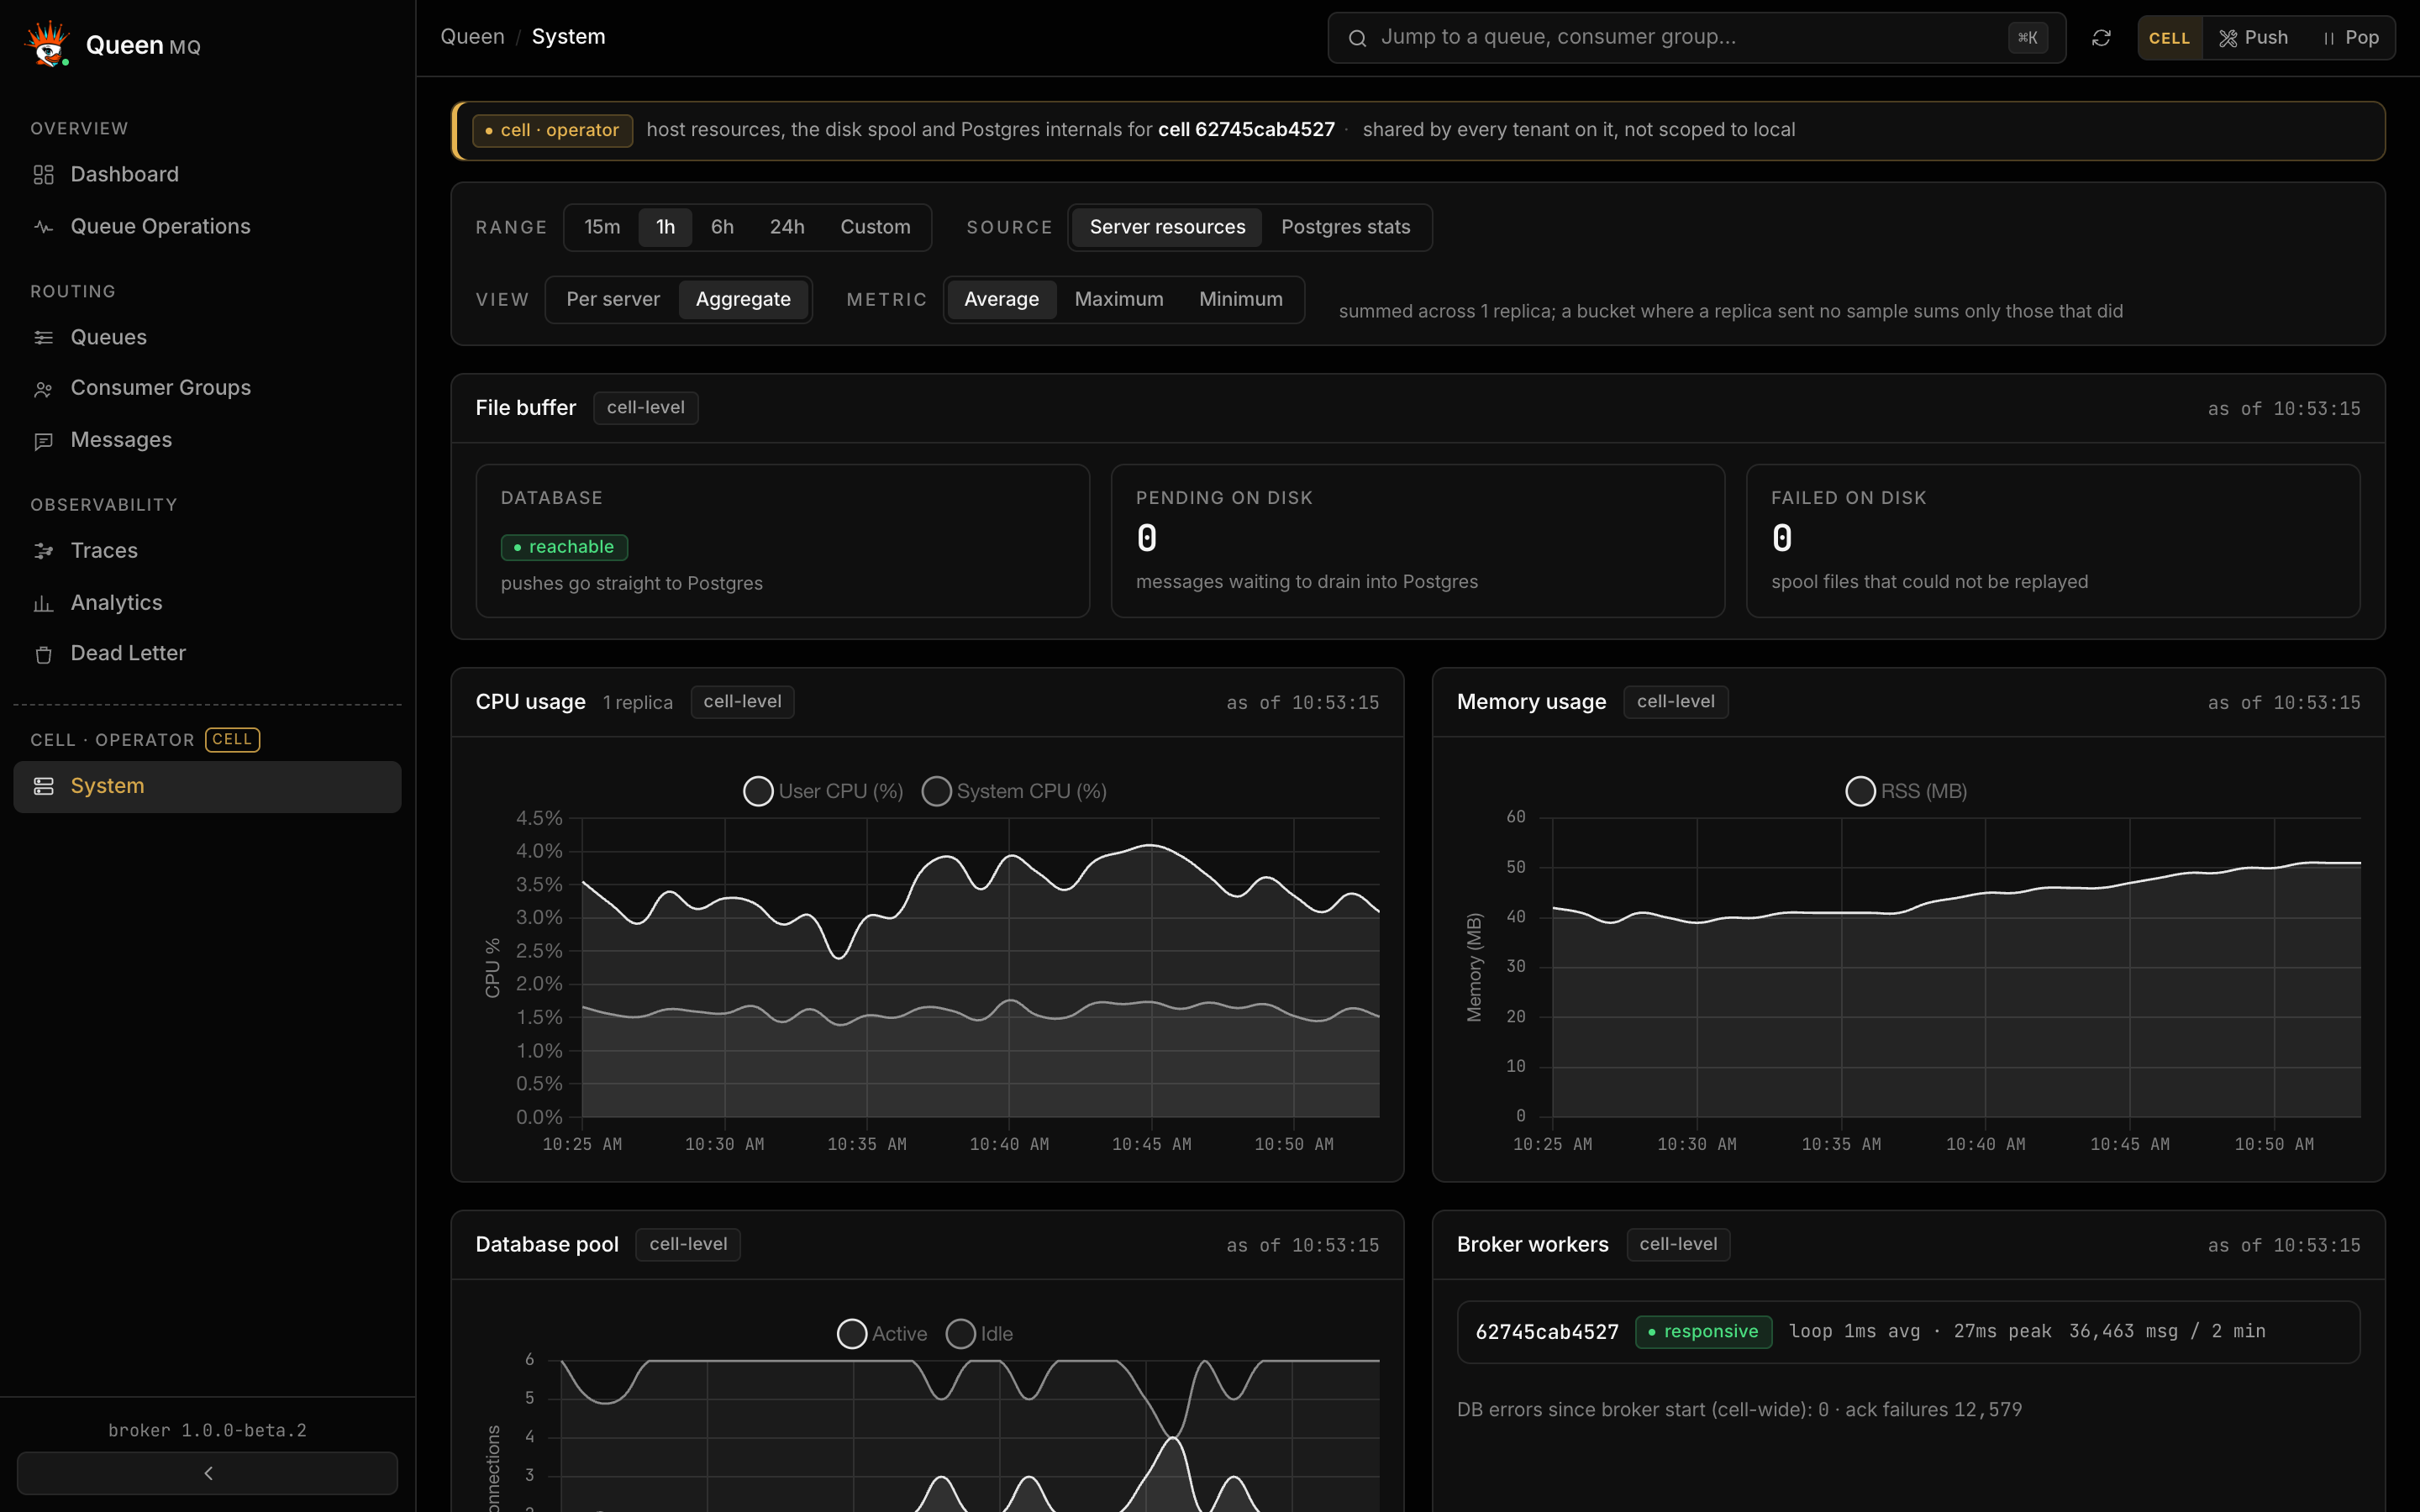
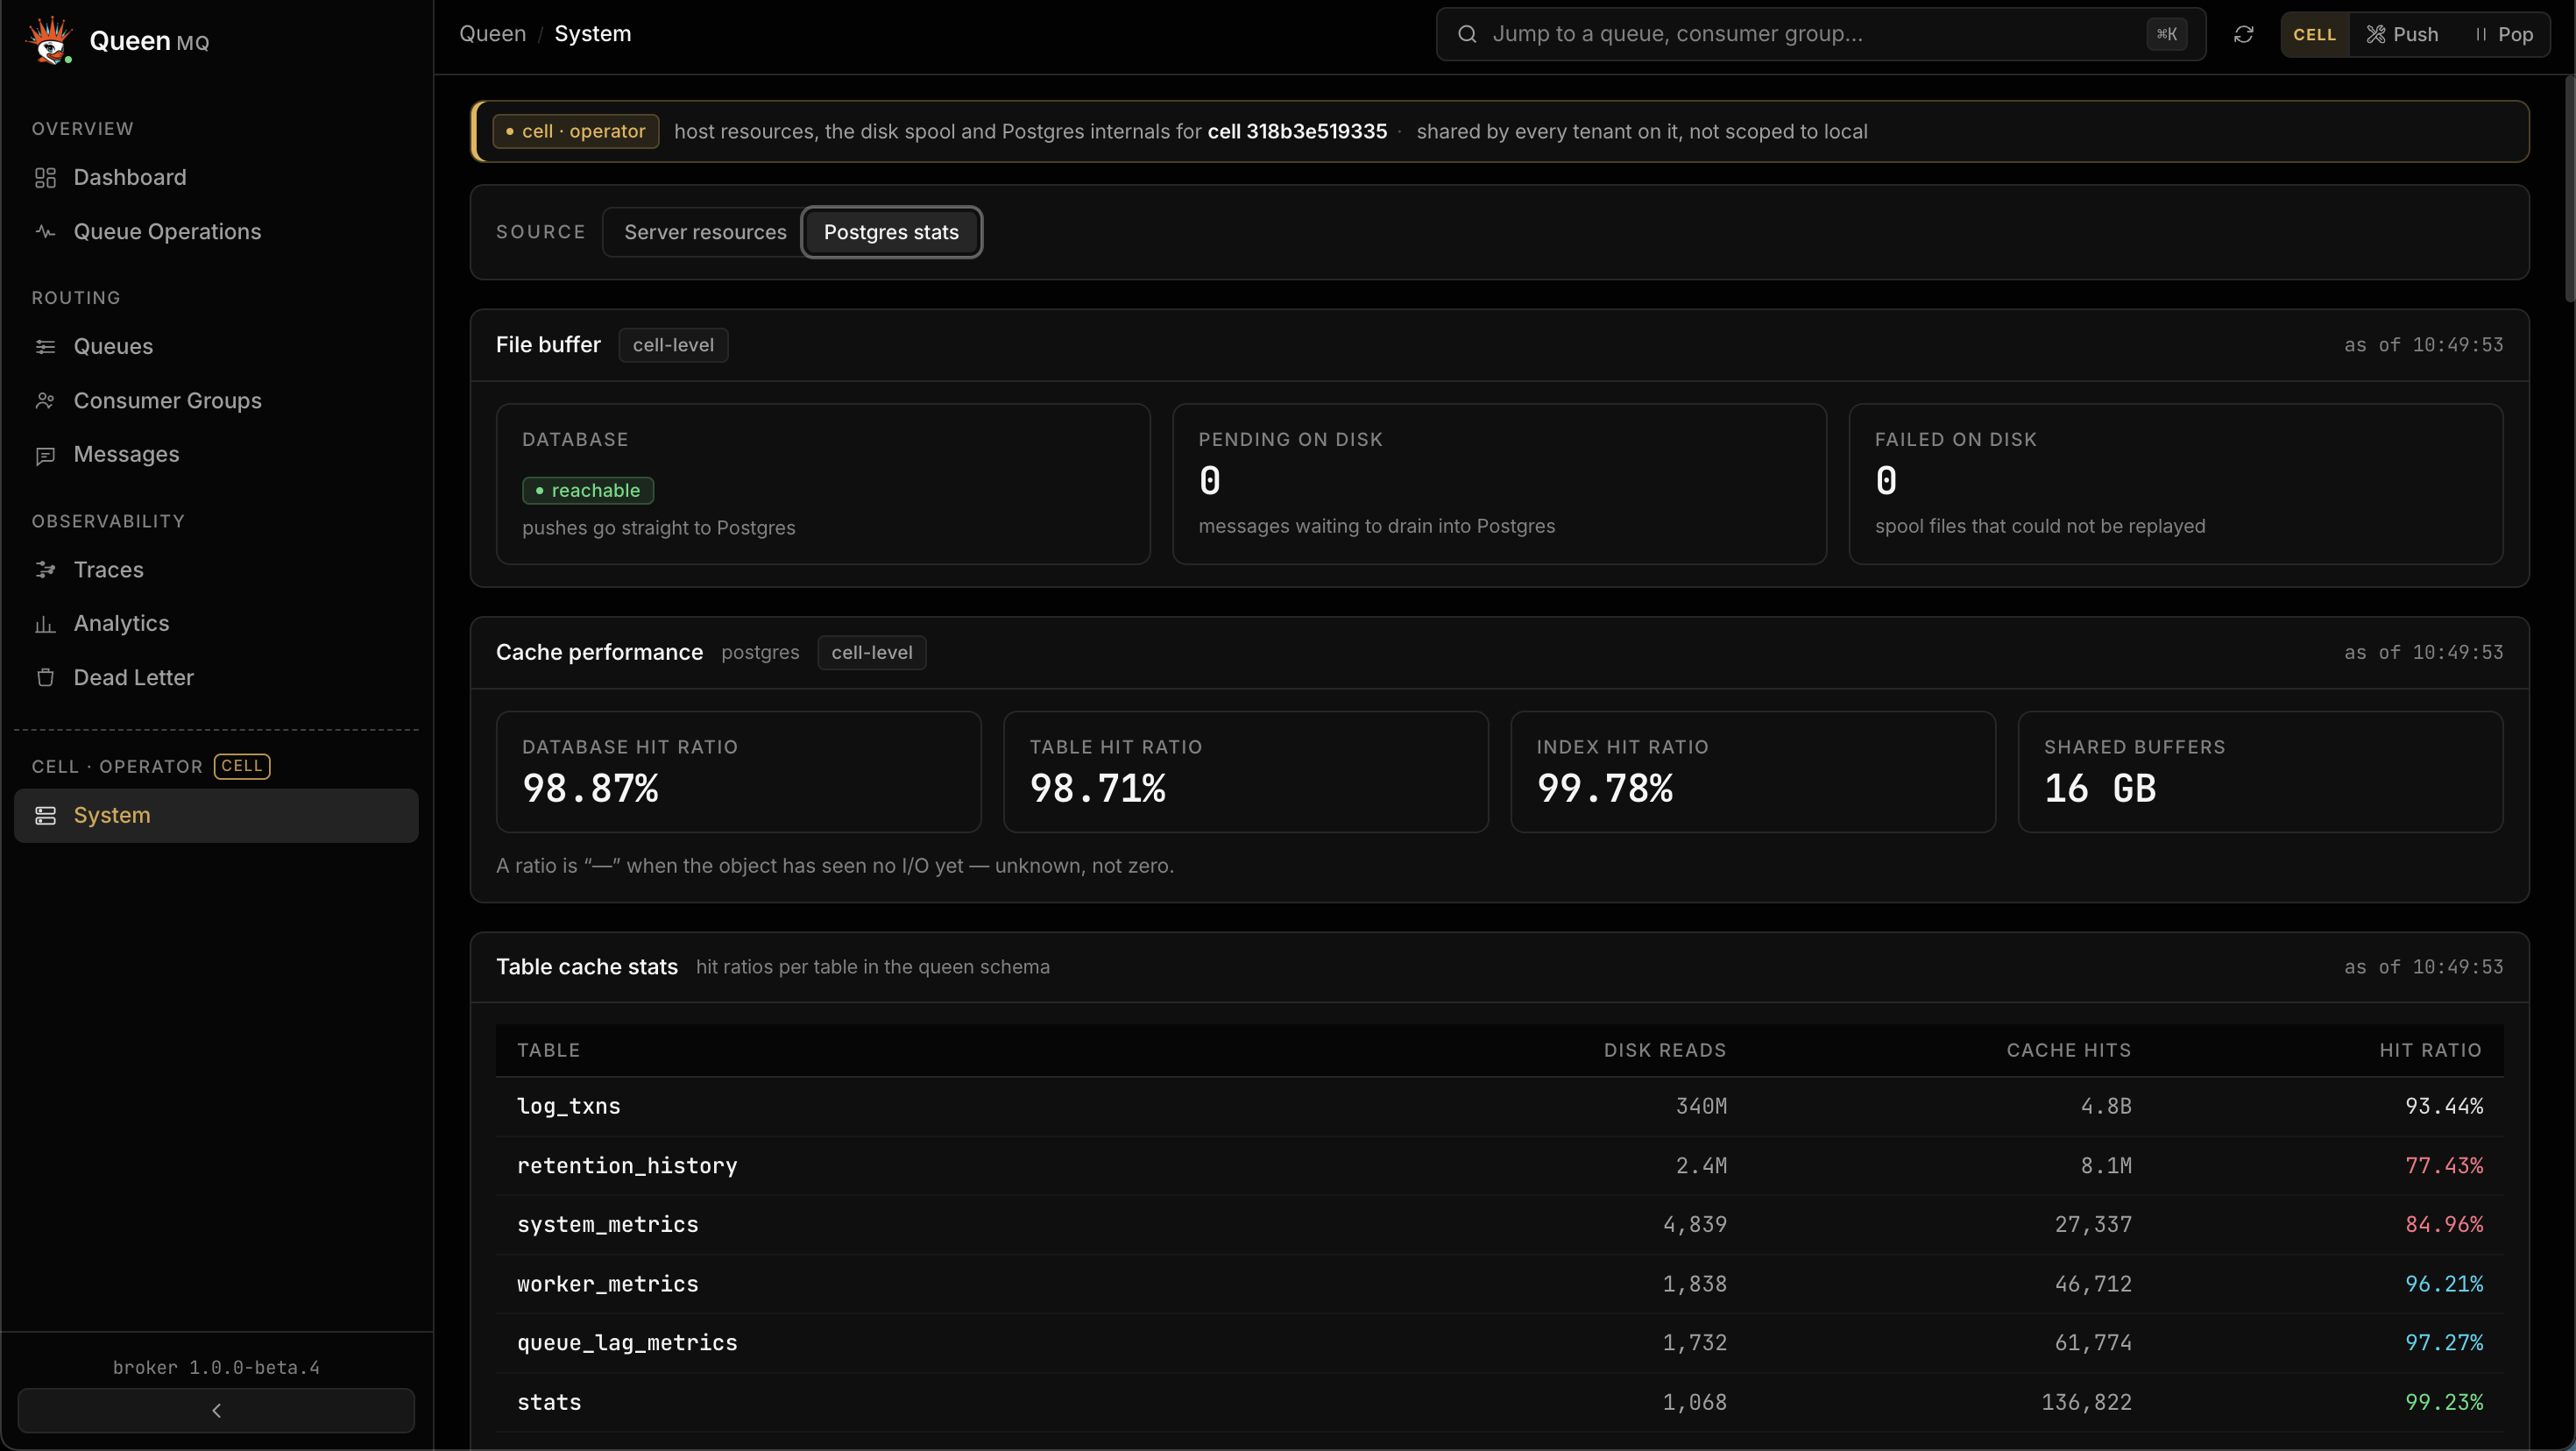
/system: cell-level host CPU and memory, worker metrics, PostgreSQL internals, the disk spool, the maintenance switch
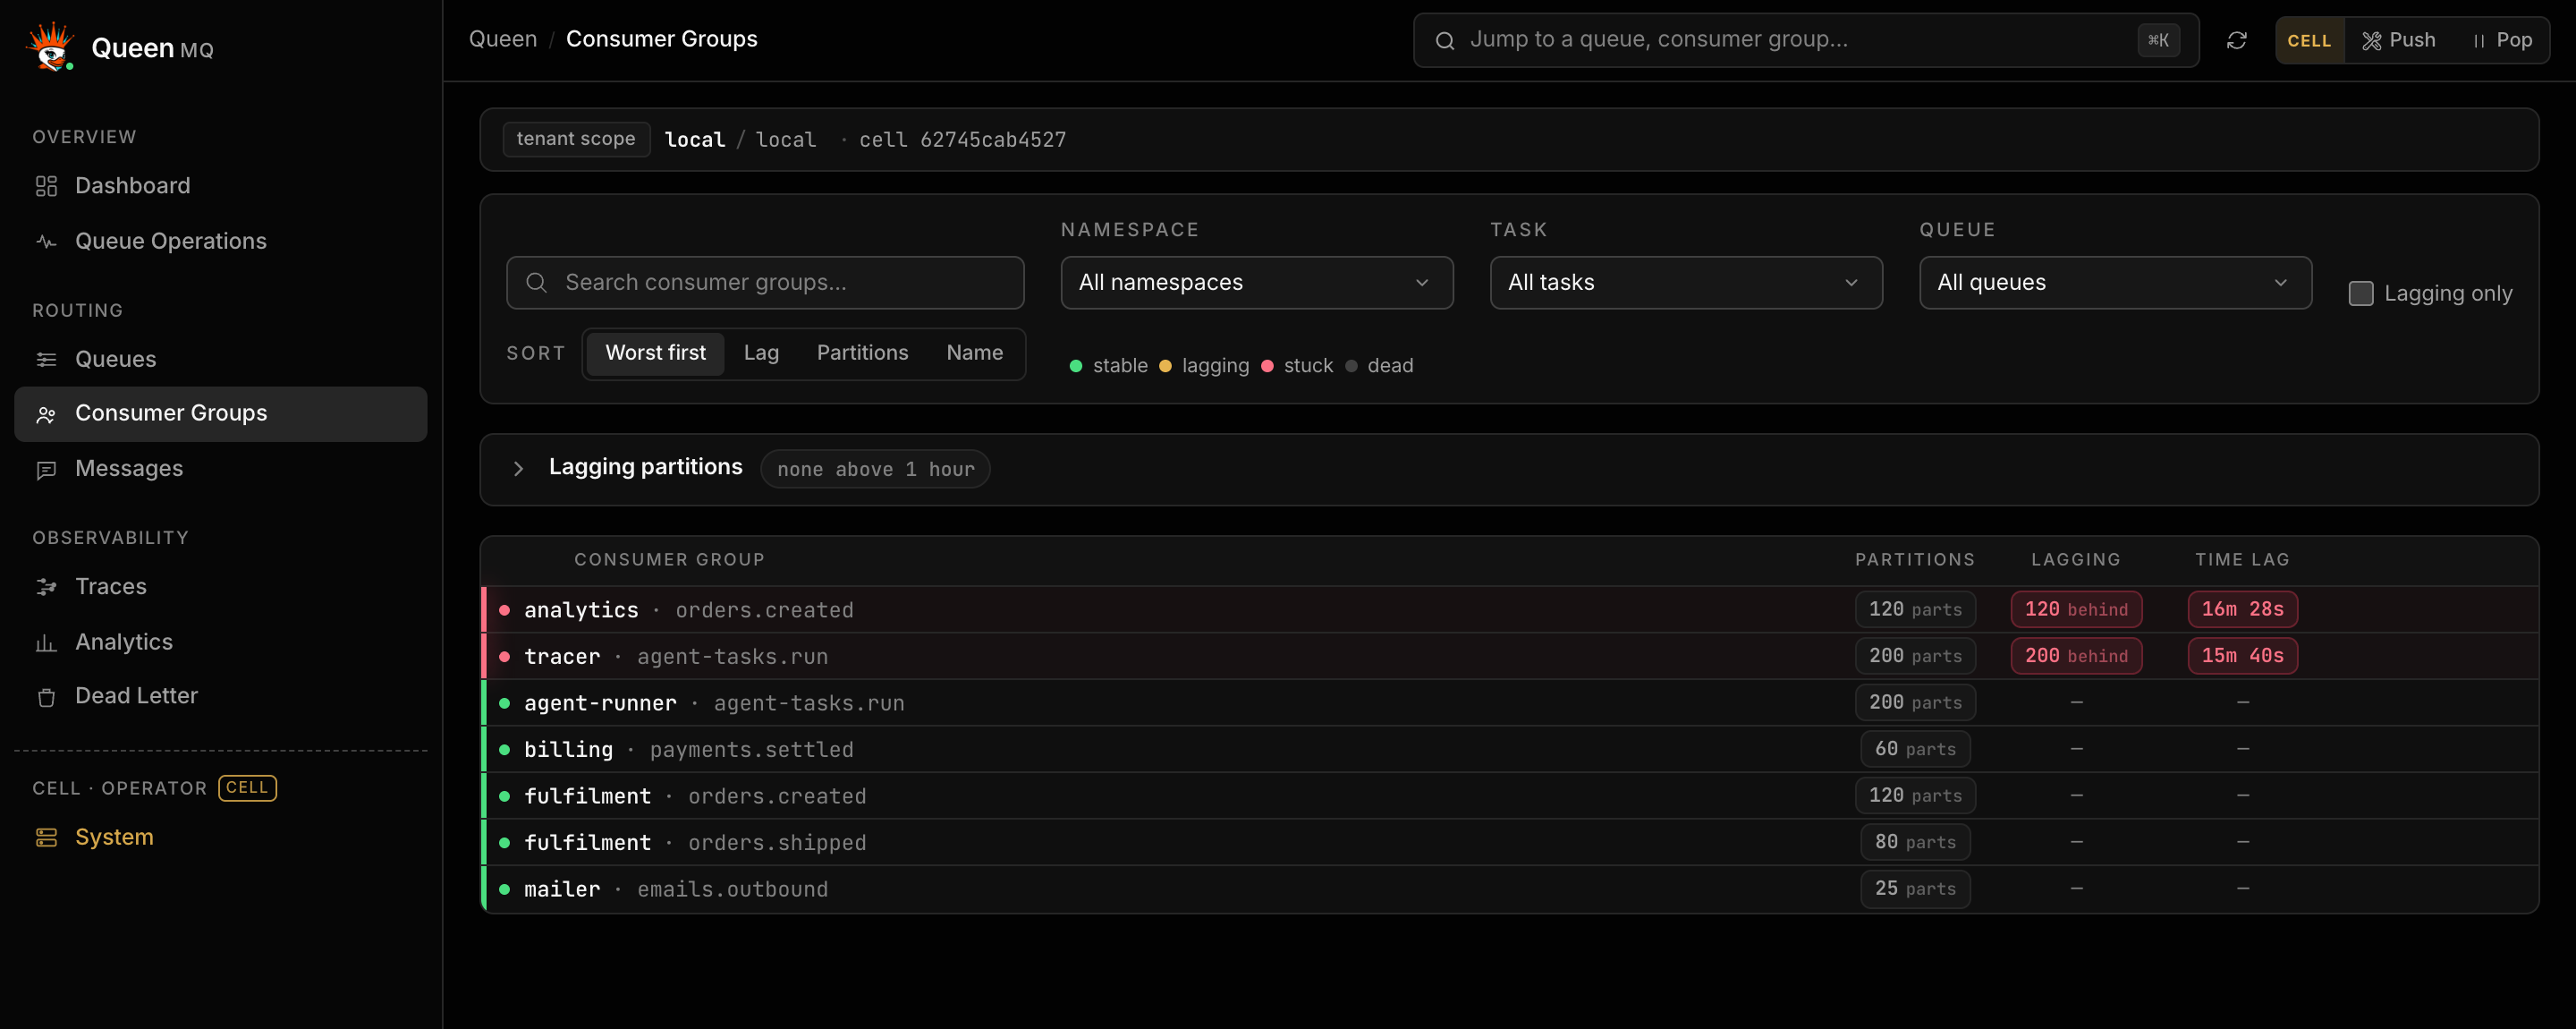
Three things to know before reading a number off this UI. System covers the whole cell and
every tenant on it, so a cell figure is not a tenant figure. The dead-letter view inspects and
purges: replaying a dead-lettered message is a broker route,
POST /api/v1/messages/:partitionId/:transactionId/retry, and
this console does not call it yet, so purge is the only action on a row. And an unknown is not a
zero: a failed call renders as a failure, and one shared ticker refreshes the page, so what you
see is one moment.
The PostgreSQL panel
System carries two sources, switched at the top of the view. Server resources is the broker:
host CPU and memory per replica or summed, worker metrics, the database pool and the disk spool.
Postgres stats reads GET /api/v1/analytics/postgres-stats and describes the database Queen
runs on, which is the throughput ceiling and the failure domain of the whole
deployment:
- cache hit ratios for the database, for the tables and for the indexes, beside the configured
shared_bufferssize - disk reads, cache hits and hit ratio per table in the
queenschema - what is resident in
shared_buffersright now, per object, as a size and a share of the cache - total, table and index size per table
- dead tuples per table, tables pending autovacuum with their vacuum count and last autovacuum time, and the HOT update percentage per table
- every query running longer than 1 second, with its pid, state, duration and wait event
Two scoping facts. postgres-stats covers the whole PostgreSQL instance rather than Queen’s
database alone, so a slow query listed here can belong to another application sharing the server,
and a proxy refuses the route to tenant credentials along with the rest of System. And a ratio for
an object that has seen no I/O yet renders as a dash rather than as 0%, because it is unknown,
not zero. A failed fetch says so in a banner and keeps the last stats that loaded, timestamped.
Who it thinks you are
The dashboard boots by calling GET /auth/me and derives every permission from that one
payload. It never guesses a role from a status code and never sniffs which binary is serving
it, so whoever answers that route is the whole difference between three deployments.
- Broker-direct, auth off, the default: a fixed standalone identity, one synthetic cluster
local, theadminrole on it, and every view including System. - Broker-direct, auth on (
JWT_ENABLED=true):401 {"code":"auth_required"}, and the login redirect lands on a terminal static page saying so. - Behind
queen_proxy: the proxy’s cookie-authenticated session, with real users, per-cluster roles, an operator flag and a login page the broker never sees.
The standalone flag hides the cluster selector and the sign-out, because there is nothing to
switch to and no session to end. Nothing is granted with it: the API was already open to anyone
reaching the port.
Assets are served with a content type and nothing else: no Cache-Control, no ETag, no
compression. Put a reverse proxy or a CDN in front if the dashboard sits on a hot path, and
scrape Prometheus rather than this UI for anything you alert on.
The source is app/, and the bytes are baked in: a change ships only after npm run build
there and a rebuild of whichever binary serves it. Debug builds of rust_embed read from disk,
so locally the npm build alone looks like enough, which is a reliable way to ship a stale
dashboard from a release build.