A four-stage pipeline over 1000 partitions, running 25,000 events per second for 600 seconds,
delivered 88,503,408 messages that a per-stage verifier confirmed as 0 duplicates, 0 gaps and 0
order violations. Deduplication window 300 seconds, explicit acknowledgement, and no ack
failed. The artifact is benchmark-queen/2026-07-23-3test-report/raw/t3.out.
Queen promises total order per partition and nothing else, and a pipeline where every stage re-emits into the next is where a violation shows.
The topology
Two flows over the same 1000 entities. Each entity (a “property”, in the channel-manager workload this models) owns one partition in every queue, so entity order is partition order.
| Flow | Ingress queue | First stage | Derived queue | Fan-out |
|---|---|---|---|---|
| Availability | cm-avail |
cm-db consumer group applies the update |
cm-ota-sync |
5 consumer groups (ota-1 … ota-5) |
| Prices | cm-prices |
cm-cal consumer group recomputes |
cm-ota-prices |
5 consumer groups (otap-1 … otap-5) |
Four queues, 1000 partitions each, twelve verified streams. Ingress is 12,500 events per second per flow, one message per request. Each first-stage consumer sleeps 10 to 30 ms to simulate work, then emits a property’s derived messages as one batched push.
goload -mode cm -> properties=1000 rate-events=25000 (A=12500 B=12500) ramp=15s duration=600s
  pop-batch=100 pop-partitions=10 pop-wait=true push-shards=1000/flow
  queues: dedupWindow=300s completedRetention=300s leaseTime=60s
Consumption is wildcard: consumers pop at the queue level and claim up to 10 partitions per call. A warm-up pushes sequence 0 for every property and drains: in production the entities already exist.
The verifier
Each producer assigns a monotone per-property sequence number, every consumer logs property and
sequence per (queue, group) pair, and the verifier streams those twelve logs.
A duplicate is a sequence seen again, counted and then skipped so a legitimate redelivery is not
reported as reordering. An order violation is a first occurrence lower than the highest first
occurrence already seen for that property. A gap is maxSeen − baseSeq + 1 minus the distinct
sequences seen, per property, clamped at zero; work still in flight lands in the in-flight
column. Violations are fatal unless acks failed, and ackErr was zero.
The verdict
benchmark-queen/2026-07-23-3test-report/raw/t3.out.The last block of raw/t3.out:
stage(queue_group)               msgs     unique     dups     gaps    viols   inflight  verdict
cm-avail_cm-db                7379349    7379349        0        0        0      27993  PASS
cm-ota-sync_ota-1             7377245    7377245        0        0        0      30097  PASS
cm-ota-sync_ota-2             7376882    7376882        0        0        0      30460  PASS
cm-ota-sync_ota-3             7376173    7376173        0        0        0      31169  PASS
cm-ota-sync_ota-4             7376503    7376503        0        0        0      30839  PASS
cm-ota-sync_ota-5             7377370    7377370        0        0        0      29972  PASS
cm-prices_cm-cal              7375023    7375023        0        0        0      32228  PASS
cm-ota-prices_otap-1          7372710    7372710        0        0        0      34541  PASS
cm-ota-prices_otap-2          7373102    7373102        0        0        0      34149  PASS
cm-ota-prices_otap-3          7373159    7373159        0        0        0      34092  PASS
cm-ota-prices_otap-4          7373210    7373210        0        0        0      34041  PASS
cm-ota-prices_otap-5          7372682    7372682        0        0        0      34569  PASS
TOTAL                        88503408   88503408        0        0        0     384150
VERDICT: PASS  (0 gaps below frontier, 0 order-violations, 0 dups, 384150 in-flight at cutoff)
msgs equals unique on every row. The 384,150 in-flight messages are work from the last
seconds that had not reached every fan-out group. The loader’s final line:
[final] producedA=7406175 producedB=7406075 | db=7379349 cal=7375023 ota=36884173 otap=36864863 |
        acked=88502190 ackErr=0 pushErr=2096 pushRetry=0 shed=0
What it cost
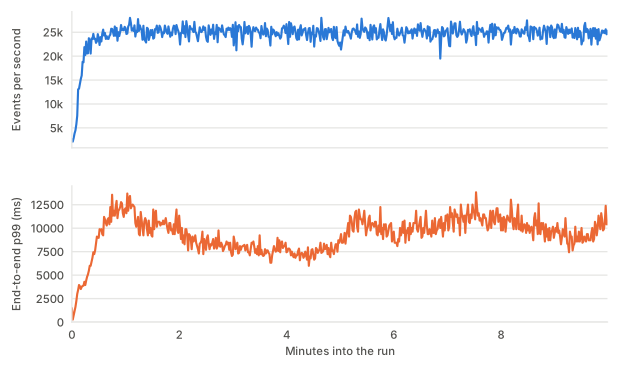
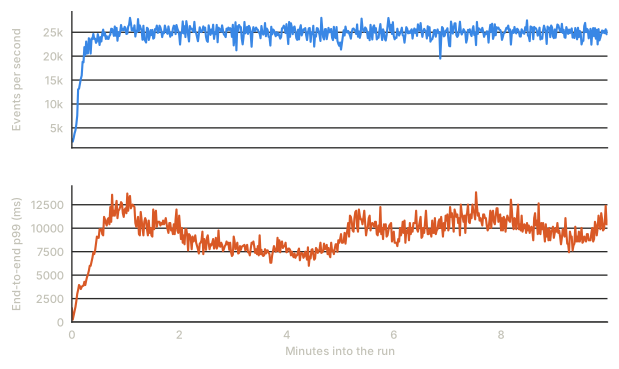
Across the 480 one-second intervals after ramp and fill:
| Quantity | Steady value |
|---|---|
| End-to-end events completing per second | median 25,114 (range 19,495 – 28,013) |
| Acks per second across all stages | median 151,000 |
| End-to-end p50 | median 1,712 ms (range 1,253 – 2,212) |
| End-to-end p99 | median 9,372 ms (range 5,997 – 13,828) |
| Ingress backlog, availability flow | median 24,000 messages |
| Ingress backlog, prices flow | median 29,000 messages |
Those latencies span the whole pipeline, producer’s scheduled instant to last fan-out group: two queue waits, two pop cycles and a work sleep per hop. Pipeline latency, not broker latency.
The run sustains roughly 350,000 message-operations per second: about 50,000 pushes, 150,000 pops and 150,000 acks. PostgreSQL used about 19 cores and the broker about 7, at about 14,000 commits per second, with the database near 8 GB.
The result took two broker fixes that ship today: the mass-creation livelock, broken by ordered provisioning inserts and a non-blocking advisory lock (life of a pop), and index churn under heavy updates, bounded by threshold-based autovacuum (storage model).
What it does not establish
- Not a throughput result. At 35,000 events per second ingress holds but intermediate consumption saturates near 29,000, on the wildcard candidate scan under allocator churn. 25,000 is the sustainable point; the throughput run is Throughput 24h 1M.
- Not a durability result. No failure injected, no broker restarted.
- No global ordering claim. The verifier checks order per property, which is per partition.
- Ordering under nacks is untested.
ackErrwas zero, so the exemption was never used; a run where acks fail would legitimately reorder first occurrences. - A 600-second window. Enough for steady state, not for accumulation.