
With server-side auto-acknowledgement and deduplication off, one broker against one PostgreSQL sustained 1,000,000 messages per second in each direction for 600 seconds, accepting 99.914% of what was offered, and never accepting 500,600 messages. Those conditions are the headline, not a caveat: this is the cheapest possible per-message path, deliberately, because the question being asked is where the pipe ends.
The artifact is benchmark-queen/2026-07-23-3test-report/raw/t1.out (test T1 of that session).
The broker was the image tagged queen-seg-rust:fix7 from branch rustserverandstorage; unlike
the 24-hour soak, this session’s record names an image tag rather than a commit. The host was
32 vCPU / 62 GiB with PostgreSQL 18 co-located and fdatasync measured at about 68 µs, the
fastest disk of the three benchmark days, which matters for a commit-bound ceiling. The loader ran
on a separate 48-core machine.
Configuration
goload -mode openloop -> queue=segbench partitions=100 consumers=850 manualAck=false ackAsync=false
  offered: rate=1000000 msg/s | push-batch=100 -> 10000.0 req/s across 64 pacer workers | max-inflight=20000 | payload=256B
[configure] queue=segbench completedRetentionSeconds=300| Parameter | Value | Consequence |
|---|---|---|
| Delivery semantics | server-side auto-ack (manualAck=false) |
The cursor commits inside the pop transaction. No lease, no ack round trip, no second transaction, and at-most-once: a lost response loses those messages |
| Deduplication | off | No probe of the transaction-id sidecar under the partition lock before allocating offsets |
| Offered rate | 1,000,000 msg/s, open loop | 10,000 push requests per second across 64 pacer workers |
| Push batch | 100 | 256-byte payloads |
| Partitions | 100 | |
| Consumers | 850 closed-loop drainers, pop batch 1000, up to 10 partitions claimed per call | Recorded in the session note; the loader’s stdout header prints only partitions and consumer count |
| Retention | on, completed after 300 s | |
| Duration | 600 s, reported every second | 600 interval lines archived |
Result
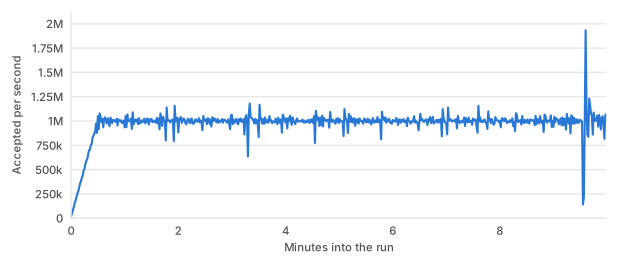
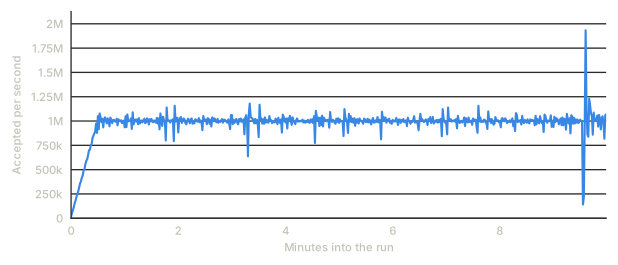
benchmark-queen/2026-07-23-3test-report/raw/t1.out.From the final line of raw/t1.out:
| Metric | Value |
|---|---|
| Messages offered | 585,023,400 |
| Messages accepted | 584,522,800 (99.914%) |
| Messages never accepted | 500,600 (0.086%) |
| Shed by the loader’s in-flight cap | 0 |
| Messages popped | 584,519,500 |
| Failed push requests | 3,032 |
| Failed pop requests | 0 |
| Final lag | 3,300 messages |
| Whole-run end-to-end latency | p50 118.27 ms, p99 667.65 ms, p99.9 2,146.30 ms |
Across the 510 one-second intervals from t=60 s to t=570 s (steady state, excluding the ramp and the teardown), the median achieved rate is 1,002,000 msg/s, with a median interval p50 of 123.4 ms and a median interval p99 of 309.3 ms. The worst single-interval p99 in that window is 1,482.8 ms, from one recovery event near t=575 s where the push rate dipped, the pop rate surged, and the lag returned to near zero within about ten seconds.
The whole-run p99 of 667 ms is therefore higher than the steady-state p99 of about 309 ms, because the whole-run histogram includes the ramp to a million per second and that one recovery. Both numbers are in the artifact; which one is honest depends on the question. For “what does this configuration deliver once it is running”, use the steady-state band. For “what did the run as a whole look like”, use the final line.
Why this is a ceiling, not an expectation
Four reasons, and each one is a property of the configuration rather than of the broker.
Server-side auto-ack is at-most-once. The pop commits the consumption cursor in the same transaction that reads the messages. There is no lease and no acknowledgement, so a response lost in flight, or a consumer that crashes after receiving a batch, loses that batch permanently: the broker has already recorded it as consumed. That removes one HTTP round trip and one PostgreSQL transaction per batch from the measured path. Work that matters does not run this way.
Deduplication off removes a probe under the write serialiser. With deduplication on, SQL takes the partition’s row lock and probes the transaction-id sidecar within the window before allocating offsets. That is what makes duplicate suppression exact, and it is not free.
0.086% of offered messages were never accepted. 3,032 push requests failed and were dropped rather than retried: the open-loop producer runs with exactly one attempt, because retrying would double-offer and corrupt the offered-rate accounting. In a real producer those pushes would be retried and would arrive; here they are gone. A ceiling run is allowed to be lossy at the edge. A production configuration is not.
Nothing was verified per message. The loader counted offered, accepted and popped. It did not number the messages and check the set on arrival.
For what the same broker does under production semantics, read the 24-hour soak: explicit acknowledgement, 600,000 per second per side, for 24 hours. The gap between 600,000 and 1,000,000 is roughly what leases plus an offset commit per batch cost on this hardware.
What the ceiling run found that shorter runs missed
This session moved to a 600-second format specifically to see accumulation, and the memory budget of the 62 GiB host turned out to break at about t=580 s, three separate times, each with a different cause:
- The broker’s deduplication cache configured with a 28 GB cap: at 64 bytes per hash, a 300-second window at a million per second is 19.2 GB steady, and alongside PostgreSQL’s 24 GB of shared buffers the host ran out.
- Cap lowered to 20 GB: the cache held flat at 19.8 GB, and PostgreSQL’s own memory reached 41 GB, ending the run at t≈583 s.
work_memat 12 MB was still not the whole story: the final blow was the first autovacuum pass overqueen.log_segments, four workers each entitled to 2 GB ofmaintenance_work_mem.
The validated configuration was shared_buffers 16 GB, work_mem 12 MB,
maintenance_work_mem 512 MB and a 20 GB cache cap. 300-second runs never saw any of this.
They finished immediately before the fill completed. That is the whole argument for long runs,
and it is why the 24-hour soak exists.
The number that is not published
The same week, a 300-second run reached one million per second per side with a much better delivery ratio, which would make a “two million per second combined” headline. It is not on this site: its stdout was not archived, so its configuration cannot be checked against its result. The configuration line in its session record does state deduplication off. The 600-second run above is the one with a complete artifact, so it is the one quoted.
Files
| File | Contents |
|---|---|
raw/t1.out |
The loader’s stdout: 600 one-second interval lines and the final aggregate |
raw/bench-t1.csv |
1 Hz sampler on the broker host |
raw/loader-t1.csv |
1 Hz sampler on the loader host |
results.md |
The session note for all three tests. Written in Italian |
The same session’s tests T2 and T3 are the explicit-ack variant at 900,000 per second per side and the ordered pipeline. To run a ladder of your own, see Reproducing these runs.