A cell is PostgreSQL, the proxy’s state database, the broker and the proxy in one CPU-capped control group: a free-tier shape is two cores covering all four, loader outside the cap.
A 2-core cell held above 2400 msg/s through the proxy with zero loss, and twelve tenants sharing one queue and one consumer group ran an hour with zero cross-tenant deliveries. Both had deduplication off and 429 retry disabled. That second setting decides the hour’s aggregate verdict: two tenants were pinned to the free plan’s rate limit, the loader never retried what enforcement refused them, and the checker counts an unretried refusal as a missing message. All 25,157 misses are those two tenants’ refused backlog, the nine untouched tenants lost nothing, and the checker’s aggregate verdict for the hour is therefore FAIL.
The throughput ladder
Four tenants on queue orders and group workers, 8 partitions, explicit acks, 40 s per point,
database dropped between points. Points failing their delivery check went unreported.
| Offered | Achieved push / pop | Cell CPU | Commits per delivered message | End-to-end p99 | Loss |
|---|---|---|---|---|---|
| 500 | 500 / 500 | 1.22 cores | 3.03 | 210 ms | 0 |
| 700 | 700 / 700 | 1.71 cores | 3.03 | 25 ms | 0 |
| 900 | 900 / 900 | 2.01 cores | 2.75 | 69 ms | 0 |
| 1100 | 1100 / 1099 | 2.01 cores | 2.15 | 86 ms | 0 |
| 1300 | 1300 / 1300 | 2.01 cores | 1.73 | 159 ms | 0 |
| 1500 | 1500 / 1499 | 2.02 cores | n/a | 216 ms | 0 |
| 2000 | 2000 / 1996 | 2.02 cores | n/a | 461 ms | 0 |
| 2400 | 2400 / 2395 | 2.02 cores | n/a | 741 ms | 0 |
Achieved tracks offered to 2400 with the cell pinned at 2.0 of its 2 cores: commits per delivered message fall from 3.03 to 1.73 as backlog builds, and past the knee the failure mode is latency, not loss. The 210 ms at the 500-point is a cold-start outlier, and 700 is the same configuration warm.
With the proxy out of the path the same cell served 900 at 1.81 cores and 43 ms: the proxy costs about 0.2 cores, roughly 100 to 160 µs per request.
The results table and the scripts are archived; the per-point raw stdout is not.
The twelve-tenant hour
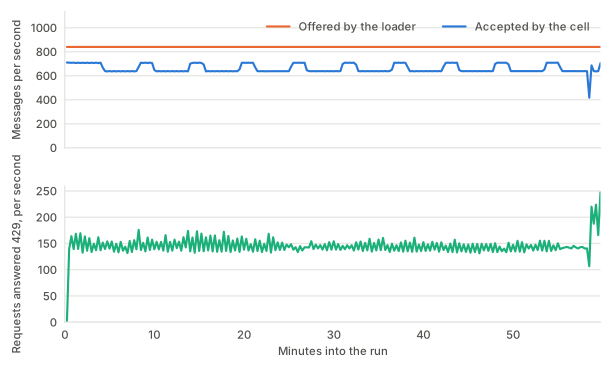
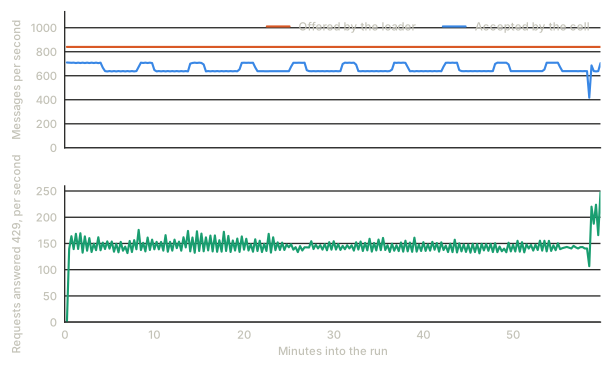
benchmark-queen/2026-07-30-1h-soak/loader-interval.csv.Twelve tenants on one queue name and one consumer group name. From soak1h.json: 840 msg/s
offered, 70 per tenant, push batch 1, 3 consumers each, pop batch 50, explicit acks, 30 s lease,
8 partitions, 256-byte payloads, retry429Attempts: 1, 3600 s through the proxy with enforcement
on. Two tenants were pinned to the free plan’s 5 requests and 20 messages a second, one to a
768 KiB quota tripping ten times an hour.
0 cross-tenant deliveries. 3,024,001 offered, 2,376,180 accepted, 2,400,397 delivered, 2,350,538 acked, 0 shed. The proxy metered 2,376,180 push messages, exactly the accepted count.
Where the misses come from
Split the twelve tenants by what enforcement did to them, and the delivery result splits with them:
| Class | Tenants | Accepted, of 252,000 offered each | Missing | Duplicates |
|---|---|---|---|---|
| healthy | the nine untouched tenants | about 251,570 each | 0 | 52 total |
| rate-limited | soak-0000, soak-0001 |
13,778 and 14,610 | 12,612 and 12,545 | 24,433 and 24,886 |
| quota-blocked | soak-0002 |
83,695 | 0 | 3 |
All of the missing and 99.9% of the duplicates belong to the two rate-limited tenants: with
retry429Attempts: 1 the loader never retries a refused request, so their backlog was never
re-offered and the checker counts it missing. The nine untouched tenants and the quota-blocked
one lost nothing.
Aggregated over all twelve, that is 25,157 missing and 49,374 duplicates across 2,400,397 deliveries, and the checker scores the hour FAIL on those totals. The number the isolation claim rests on is the one above it: 0 cross-tenant deliveries.
Resources
| Quantity | Value |
|---|---|
| Cell CPU | median 1.87 cores against the 2-core cap, maximum 2.19 |
| Broker resident memory | 46 MB, flat all hour; 33 MB once load stopped |
| Broker-side p99, push | median 2.86 ms across 360 under-load samples, maximum 57.9 ms |
| Broker-side p99, pop | median 2.75 ms, maximum 64.9 ms |
| Hot-list wheel depth | median 635, maximum 737: bounded, not growing |
| Push round trip | p50 1.59 ms, p99 56.1 ms |
| Ack round trip | p50 1.35 ms, p99 6.24 ms |
| End to end, whole run | p50 6.30 ms, p95 59.6 ms, p99 133,693 ms |
Broker-side and end-to-end p99 are not interchangeable: the end-to-end figure carries the throttled tenants’ backlog.
What they do not establish
- Nothing about high availability. Single broker.
- Not a delivery-ratio result. The claim covers the nine unthrottled tenants.
- Not a long soak. One hour; Throughput 24h 1M had no proxy.
- One 15-second interruption at t=3510 s: 818 gateway errors and 4,392 refused connections, cause unrecorded.
- 429 retry disabled, so enforcement would show: 527,472 rate-limit 429s, 167,873 quota 403s.
- One shape. Push batch 1, pop batch 50, 256-byte payloads, 8 partitions.