
The Laravel panel shows what this application’s Queen supervisors are doing. It reads the state the PHP or Rust engine writes on its host, and the copy each engine can publish to the broker for web servers on other hosts. Its pages also read the broker for what the queues hold and how many jobs ran. It is off until you turn it on, and in production it lets nobody in until your application says who may.
QUEEN_DASHBOARD_ENABLED=true
QUEEN_DASHBOARD_PATH=queen
QUEEN_DASHBOARD_REFRESH_SECONDS=5
QUEEN_DASHBOARD_FAILED_JOBS_LIMIT=50
Open /queen. In the local and testing environments the panel lets you in while
queen.dashboard.allow_local is true; set QUEEN_DASHBOARD_ALLOW_LOCAL=false to try the
production path on your machine. Each sidebar section is its own page, so a reload or a shared
link lands on the same view:
| Page | Path | What it shows |
|---|---|---|
| Overview | /queen |
processes, sampled depth, failed jobs, engine, heartbeat |
| Workload | /queen/workload |
what each queue holds now and jobs processed |
| Supervisors | /queen/supervisors |
one card per supervisor instance, with its pools |
| Jobs | /queen/jobs |
throughput and runtime per job class |
| Tags | /queen/tags |
monitored tags and their recent jobs |
| Failed jobs | /queen/failed-jobs |
Laravel’s failed jobs, why each failed, and a retry |
| Configuration | /queen/configuration |
tuning advice and every Queen setting |
Each page refreshes itself every QUEEN_DASHBOARD_REFRESH_SECONDS: a small packaged script fetches
the page again and swaps only the header and the main region, so your scroll position and the
sidebar stay put. Pause auto-refresh in the header stops it, and the browser remembers the
choice. Refreshing waits while the tab is hidden, while text is selected or while a control you are
using would be replaced, and it stops with a notice when the answer is no longer the panel (after
the session expired, say). Without JavaScript the pages still work, reloading whole through a
<noscript> refresh.
If Laravel has cached its routes and configuration, a change to the path, domain, enabled flag or middleware needs both caches rebuilt:
php artisan config:clear && php artisan route:clear
php artisan config:cache && php artisan route:cache
Authorize production access
Enabling the route is not enough in production: the panel denies everyone until the application
defines the viewQueenDashboard Gate ability. Put your authentication in front of it:
// config/queen.php
'dashboard' => [
    'enabled' => env('QUEEN_DASHBOARD_ENABLED', false),
    'path' => env('QUEEN_DASHBOARD_PATH', 'queen'),
    'middleware' => ['web', 'auth'],
],
use Illuminate\Support\Facades\Gate;
Gate::define('viewQueenDashboard', function ($user): bool {
return $user !== null && $user->canOperateQueues();
});The package always keeps Laravel’s web middleware, even if you leave it out of the list, because
the controls change state and must keep their session and CSRF protection. The same Gate guards the
HTML pages, the JSON status and the controls, so a Gate that returns true for everyone hands any
visitor the pause button. Put the panel behind the same network and identity controls as any other
administration page.
What the panel shows
The overview and the supervisor cards show each master’s engine, host, PID, state, generation and heartbeat; whether its status is local or published by a supervisor on another host; its pools, queues and worker counts, the workers draining, and the restart and circuit state; and the last depth each pool sampled. When more than one running master autoscales the same queue and consumer group without coordinating, the panel warns, and each coordinated pool shows its share of the replicas.
Some things stay off the page on purpose. The read model returns no broker endpoint, bearer token, custom header, job payload or raw backend error. A broker endpoint appears as scheme, host and port, a credential as set or not set, and exception text only on the detail page of a failed job. A failed-job store the panel cannot read safely is shown as unavailable, never read without a bound.
What the panel controls
Three controls act on the whole local master:
| Control | Effect |
|---|---|
| Pause | drain the current workers and start no replacements |
| Continue | resume and start workers as needed |
| Terminate | drain, stop the master, and let the outer process monitor start a fresh one |
Each form carries the exact supervisor instance_id, so a page left open across a deploy cannot
pause or terminate the replacement master, and a second command never overwrites one still
pending.
| HTTP answer | Meaning |
|---|---|
404 |
the dashboard is off, or its route is not registered |
403 |
the viewQueenDashboard Gate said no |
419 |
the CSRF token is missing or expired |
409 |
the supervisor was replaced, is stale or unavailable, runs on another host, or already has a pending command |
303 |
the command was accepted; the panel redirects back |
Your authentication middleware runs before the Gate, so an unauthenticated request may redirect or
answer 401 instead, depending on the guard. The control TTL and the heartbeat timeout are the ones
the running master published: a newly deployed configuration cannot reinterpret an old master’s
liveness or replay an expired command. Restart the supervisor to change them.
In the queue now
The Workload page opens with one row per supervised queue: its consumer group, the jobs waiting for a worker, the jobs running now, and how long the oldest unfinished job has been in the queue, waiting or running (PHP client 1.9.0). It is a summary; the Queen dashboard lists the messages themselves.
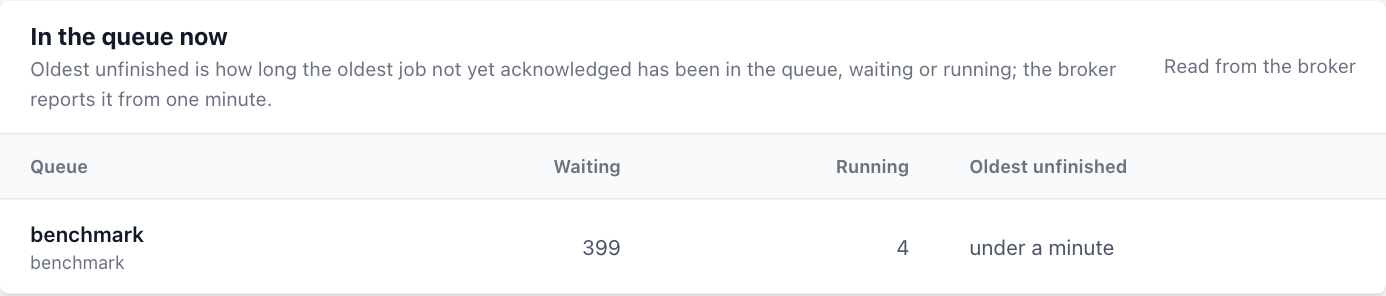
| Column | Read from the broker |
|---|---|
| Waiting | ready in the consumer group’s depth, GET /api/v1/resources/queues/:queue/depth |
| Running | processing in the same depth: jobs under a worker’s lease, prefetched ones included |
| Oldest unfinished | the queue’s oldest partition for the group in GET /api/v1/consumer-groups/lagging |
The panel asks the broker only for partitions whose oldest unacknowledged job is more than a minute
old, so a younger age reads under a minute. Ten minutes or more gets a warning badge, an hour a
danger badge. A queue the broker does not answer for is marked Unavailable, and an age the
broker could not report shows as a dash, never as under a minute. Only the Workload page reads
these figures: one depth request per queue and one lag request per connection, in parallel, with
the supervisor’s read_bearer_token when one is set, one attempt of at most five seconds, cached
for five seconds in Laravel’s default cache store. The card shows at most 32 queues.
Set the address of the Queen dashboard and every row links to it: Open in console opens the
queue’s page, /queues/{queue}, and the waiting and running numbers open its messages filtered to
pending and processing (/messages?queue={queue}&status=pending).
QUEEN_DASHBOARD_CONSOLE_URL=https://queen.example.comThat is the address you open the Queen dashboard at: the broker’s own port, 6632, or the port of
its embedded proxy when that is your front door. The value must be an http
or https URL without user info, query or fragment; a path is kept, for a dashboard behind a
prefix. One address serves one broker, so when the supervised queues use more than one connection,
the card shows no links and says why. An invalid value is reported to the application’s log when it
boots and turns the links off; it never stops the application or its workers, which boot the same
service provider.
Jobs processed
The Workload page also charts how many jobs completed and failed per time bucket, like Horizon’s
throughput view. It reads the counters the broker already keeps for every queue, through
GET /api/v1/analytics/queue-ops, so it adds no write to the job path and needs no setting.
| Figure | Broker counter | For Laravel jobs |
|---|---|---|
| Completed | ackSuccess |
acknowledgements with status completed |
| Failed | ackFailed |
acknowledgements with any other status, which for Laravel jobs is the move to the dead-letter queue |
| Dispatched | pushMessages |
jobs pushed to the queue |
The 2.0 broker counts the legs of a transaction too. A release acknowledges the job as completed and pushes its copy in one transaction, so each released attempt adds one to Completed and one to Dispatched, and a hand-back does the same for each job it returns. A delayed job is never counted as dispatched, because a timer’s fire is not a push. An acknowledgement is counted as it was asked for, before the broker judges it, so a refused one counts too. The counters are per queue: every consumer group that acknowledges the queue adds to them.
The 1h, 6h, 24h and 7d links set the window, and the window sets the bucket width
the broker uses: 1 minute for an hour, 5 for six hours, 15 for a day and 60 for a week. The window
stays in the address (?range=24h) and in the automatic refresh, and times are in UTC. A 2.0
broker keeps these per-queue counters for 24 hours by default, so the week view shows only the last
day unless the operator raises QUEEN_DASH_QUEUE_RETENTION_H. In a cluster every node counts the
requests it served and writes its counters once a minute, and the broker adds the nodes up when it
answers, so the current minute appears once it has ended. The page sends one request per queue, in
parallel, with the read token when one is set and a timeout of at most five seconds, and caches the
result for fifteen seconds.
Failed jobs and the broker’s dead-letter queue
Laravel stays the index of failed Laravel jobs, and its commands keep the broker’s dead-letter
entry in step with the failed_jobs row (failed jobs):
php artisan queue:failed
php artisan queue:retry <id>
php artisan queue:forget <id>
php artisan queue:prune-failed
The failed-jobs page shows QUEEN_DASHBOARD_FAILED_JOBS_LIMIT jobs, newest first, with Older
and Newest links. It pages with a keyset cursor instead of an offset: on a database store each
page is one range read on the primary key, with one extra row to learn whether an older page exists,
and never a COUNT(*). A table with millions of failed jobs costs the same per page as a table with
ten, and the total shows as a lower bound (51+) when there are more. A file store is read whole,
within the 4 MiB bound the panel always applies, and its pages are positions, so a new failure
while you read an older page shifts it by one row.
Why a job failed
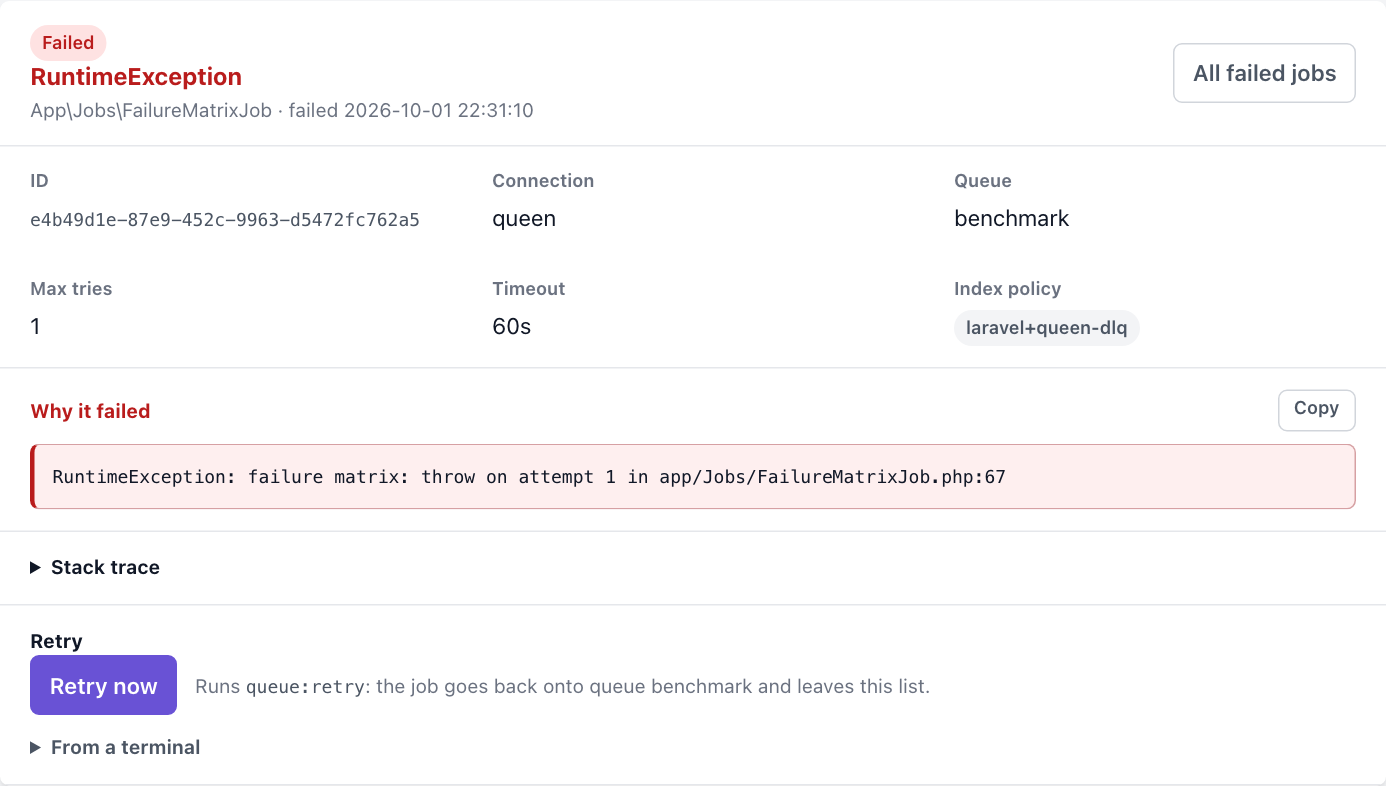
Each row opens its job in a drawer beside the list; Open as page shows the same detail at
/queen/failed-jobs/{id}, which is also where the row leads without JavaScript. The detail shows
the job class, the queue and connection, the maximum tries and timeout read from the payload, the
exception class and message under Why it failed, the stack trace, and the queue:retry command
for that job. The message, the trace and the command each have a Copy button. The payload is
never displayed, paths under the application root are shown relative to it, and the exception and
payload are read from the store cut to 1 MiB, so a row of many megabytes costs no more memory than
that. The page shows no attempt count, because Laravel keeps its payload counter current only on the
Redis driver and it would read 0 for a job that used every try. The exception message can carry
application data, which is why the page sits behind the same Gate as the rest.
Retry now (PHP client 1.9.0) runs Laravel’s queue:retry for that one job, as the command
does, so the job keeps its retry fence and its dead-letter entry is cleared with the row. It posts
to /queen/failed-jobs/{id}/retry with the CSRF token and the same authorization as the rest of the
panel. A job that goes back onto its queue leaves the list; a retry that cannot run keeps the job
and shows Laravel’s reason. Forgetting, flushing and pruning have no button: use the commands.
Do not retry a Laravel job from the dead-letter page of the Queen dashboard: that replay knows
nothing about failed_jobs, the attempt count or the cleanup. The two dashboards cover different
ground on purpose:
| Laravel panel | Queen dashboard |
|---|---|
| this application’s supervisors | every queue and consumer group the broker serves |
| worker processes and restart state | backlog, partitions, lag, messages, the cluster |
| Laravel’s failed-job index | the dead-letter queue itself |
| pause, continue, terminate a master | broker and queue administration |
Tuning advice and settings
Since PHP client 1.9.0 the Configuration page opens with Tuning advice, read from this application’s settings, what the running supervisor published, the failed-job count and the last hour of job metrics. Each item has a severity, the evidence, what to do, and a link to these pages. When nothing calls for a change, it says so.
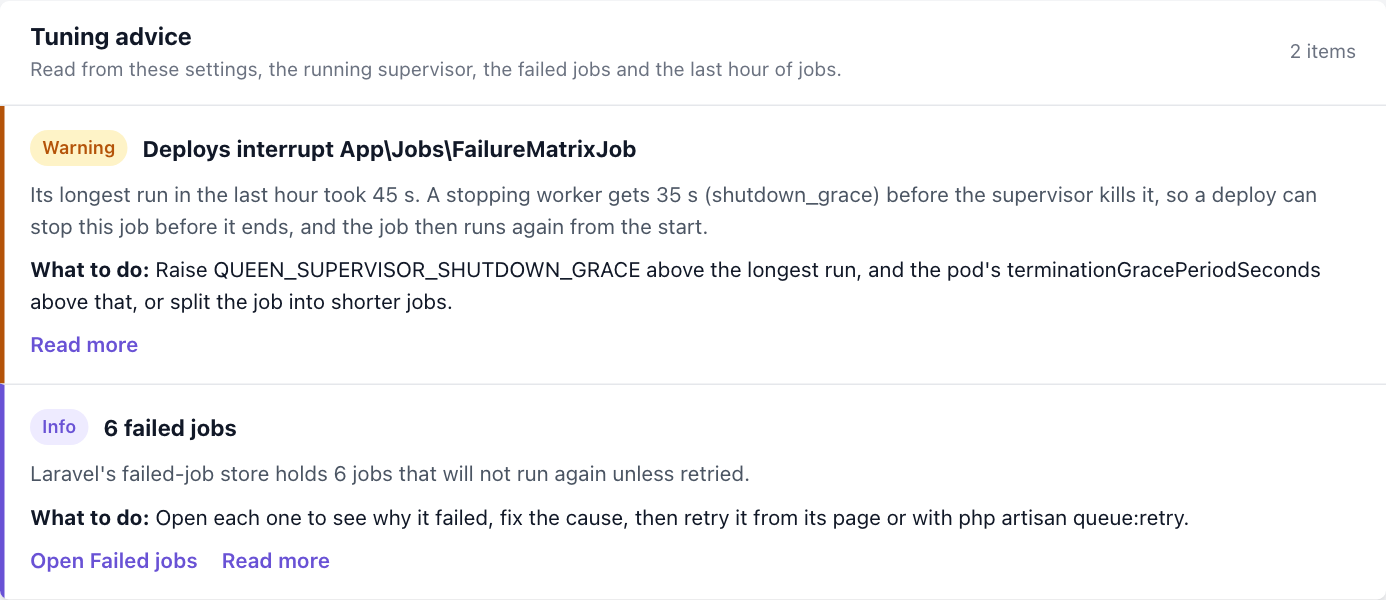
| Severity | Advice when |
|---|---|
| Critical | lease renewal is off and a pool’s timeout is at least its retry_after: a job still running when its lease ends goes to a second worker |
| Critical | lease renewal is on and a pool’s timeout is at least its retry_after: the supervisor refuses to start that pool |
| Warning | the longest run of a job class exceeds shutdown_grace: a deploy kills that job, and it runs again |
| Warning | a pool with max_processes 1 serves two or more queues, and one of them has a backlog |
| Warning | several running supervisors autoscale one queue without coordination |
| Warning | a pool has tries 1 on a connection with prefetch above 1 or pop_ahead: a crash that is not handed back fails each job the worker held but had not started |
| Info | prefetch is 1, pop_ahead is off, and classes that ran at least 60 times average under 100 ms |
| Info | prefork is off |
| Info | lease renewal is on, but QUEEN_SUPERVISOR_LEASE_SERVICE=false turns off renewal in the master |
| Info | a pool follows the backlog without event-driven scaling |
| Info | Laravel’s failed-job store holds jobs |
The pools and shutdown_grace are the running supervisor’s when one published its status,
otherwise this application’s. The critical items always read this application’s pools: the
supervisor will not start such a pool, so only a worker started another way runs it. Below the
advice, Settings lists every Queen setting as this host resolves it, with its value, default,
meaning and environment variable: the connection, the supervisor (including
QUEEN_SUPERVISOR_LEASE_SERVICE from this host’s environment) and the pools. A changed value is in
bold, a value of the wrong type or out of range shows as invalid, and a value the connection
refuses with another setting, such as prefetch above 1 without lease_renewal, shows the reason.
A setting whose name contains token, secret, password or key shows only set or not
set, a broker URL only its scheme, host and port, and the headers only how many there are.
A supervisor on another host
The panel reads one local state directory. When the dashboard is served by other processes than the supervisor (web pods beside a worker pod, say), that directory is empty and the supervisor shows as unavailable. Either engine can close the gap by also publishing its status to the broker’s key/value store:
QUEEN_SUPERVISOR_REMOTE_STATUS=true
QUEEN_SUPERVISOR_REMOTE_STATUS_KEY=orders-production
Set both on every supervisor host and on every web host, so the publishers and the reader use the
same key, and use one key per application and environment that share a broker. Each supervisor
instance publishes into its own slot under the key, named by its instance_id, so several hosts or
pods never overwrite each other.
| Variable | Default | Meaning |
|---|---|---|
QUEEN_SUPERVISOR_REMOTE_STATUS |
false |
publish the status document |
QUEEN_SUPERVISOR_REMOTE_STATUS_KEY |
none | the key the documents go under; required when on |
QUEEN_SUPERVISOR_REMOTE_STATUS_CONNECTION |
queen |
the queue connection whose broker and credentials are used |
QUEEN_SUPERVISOR_REMOTE_STATUS_NAMESPACE |
queen-supervisor |
the key/value namespace |
QUEEN_SUPERVISOR_REMOTE_STATUS_INTERVAL |
poll_interval |
seconds between publishes; a state change publishes at once |
QUEEN_SUPERVISOR_REMOTE_STATUS_TTL |
twice heartbeat_timeout, at least 300 |
how long a published copy lives |
The Supervisors page then shows one card per instance: a live local supervisor first, then every
published one, live before stale, each with its host, PID and last heartbeat. The overview, the
header and the notices add up workers, draining processes and the process budget over the live
instances, and report ready or healthy only when every live instance is. A stopping or stopped
master is not live, so the old pod of a rollout stays listed as stale until its copy expires and
never counts in those totals. A published instance is read-only: pause, continue and terminate stay
with php artisan queen:supervisor on its own host, and a control request for it answers 409.
Liveness comes from the published heartbeat alone, because a web host cannot check another host’s
lock, so keep heartbeat_timeout and the supervisors’ clocks sane.
The document travels split across <key>/<instance_id>/head and <key>/<instance_id>/chunk/NNNN,
written in one key/value batch, so its size never runs into the store’s value ceiling (64 KiB by
default, QUEEN_KV_MAX_VALUE_BYTES). The panel lists every slot with getPrefix and decodes each
from one page, which is one snapshot; a slot a page cuts through is read whole on the next one.
Chunks left by an earlier, larger write are recognized by their write id and expire with their TTL.
Publishing is a key/value write, so it uses the connection’s write credential, never
read_bearer_token. It is best effort: one request timeout per broker endpoint is added to the
heartbeat budget, a failure is reported once per failure streak, and a broker outage shows the
supervisor as stale without ever stopping supervision. The Rust engine publishes from PHP client
1.5.0 (supervisor 0.2.0), and into its own instance slot from 1.6.0 (supervisor 0.3.0).
Behind a load balancer
Without remote status the panel is not a multi-host view. Route the administration path to the host that owns the supervisor, or use a sticky admin endpoint: a page read from host A followed by a control posted to host B fails the instance fence on purpose.
The panel loads no fonts or assets from a CDN and has no inline scripts, style blocks or style
attributes. The package serves its content-hashed stylesheet and refresh script from the dashboard
routes, with Subresource Integrity, and its Content Security Policy allows scripts, styles and
fetch only from the same origin. Dynamic responses are no-store; asset responses are cached
privately for a year, immutable, with transformations disabled so the integrity digest holds.
Responses also deny framing and MIME sniffing and send no referrer.
Some web servers answer every *.css and *.js request from the public directory and never reach
PHP (a common nginx or Caddy rule for static files). The asset routes then return the web server’s
404, and the panel renders unstyled with whole-page refreshes. Publish the assets, as Horizon does
with its own:
php artisan vendor:publish --tag=queen-assets --forceThe copies land in public/vendor/queen/dashboard.css and public/vendor/queen/dashboard.js. The
panel links to each, with the same integrity digest, only while it is byte-identical to the packaged
file, so a stale copy after an upgrade falls back to the route and can never serve the wrong styles.
The files are also tagged laravel-assets, which Laravel’s default post-update-cmd republishes on
every composer update; in a container build, run the publish command beside your other asset
steps.
For Prometheus and autoscalers, the same state is on /queen/metrics, with its own bearer token
and no session (monitoring).